the mutual wave machine
Welcome!
On this page you can explore the research findings from the Mutual Wave Machine, a “crowdsourcing” neuroscience experiment: scientists asked the general audience to help them understand what happens in our brains when we interact face-to-face with another person.
If you were one of those participants: *THANK YOU!*
what is the mutual wave machine?
What does it mean to be ‘on the same wavelength’ with another person? When you feel connected to another person, are your brainwaves literally ‘in sync’? The Mutual Wave Machine is a brain experiment meets interactive art installation.
We use a crowdsourcing neuroscience approach to find out when our brainwaves synchronize with each other during dynamic social interactions. In other words: researchers collaborate with the general public to explore what makes people ‘click’.
Thousands of museum and festival visitors have worn EEG headsets to record their brainwaves while they sat inside the Mutual Wave Machine and interacted face-to-face with a stranger or loved one for 10 minutes. In the meantime, they were immersed in a real-time reflection of their ongoing brainwave synchrony (or, more accurately: correlations of their EEG signals, as explained below).
In 2016, The Mutual Wave Machine won the Art of Neuroscience Award
Want to read a scientific description of the study & results? You can find a manuscript for a scientific audience here
Interested in exploring the data yourself? All the datasets will live here
Background: brains in sync during real-world social interactions
From studying the brain in isolation to studying the brain in conversation
Most neuroscientists study brains in isolation, that is to say: people come to the laboratory and watch images or listen to sounds while their brain activity is recorded. This way of studying human perception and action, in a very controlled and detailed manner, has led to many important brain discoveries. But, as you can imagine, there are also some limitations. To start, it is not immediately obvious that laboratory tasks (e.g., clicking on a button as soon as possible when you see a green line on the screen) are representative of the real-world perceptual problems that our brains have to solve. Second, people who come to the lab are often university students, which may not be a fully representative demographic. Finally, if you are interested in how our brains support our social interactions with other humans, this approach is lacking in that people rarely interact with another person during laboratory studies.
The Mutual Wave Machine takes a new data collection approach to try to tackle these limitations in laboratory research: we measure the brain activity of people of all ages and backgrounds as they interact with each other naturally.
Specifically, we asked when brain activity becomes synchronized between people.
It has been known that synchrony between people is an important phenomenon in social cohesion. Take dancing for example, or even walking down the street: we automatically synchronize our moves. Recently, researchers have begun to study such synchrony at the brain level: taking a ‘hyperscanning’ approach, neuroscientists record brain activity from participants during social interaction and compare brain activity between them. So far, factors that have predicted inter-brain synchrony (= similarities in the brain responses of people) include: (i) listening to or watching the same stimulus (ii) social coordination, like conversation or joint action (iii) social intentions, like cooperation vs. competition and (iv) social closeness, for example how much students like their classmates.
If you are interested in reading about all of our synchrony-based art/science work, see this review
who participated?
Nearly 5000 people have participated in the Mutual Wave Machine thus far, and thousands more have seen the experiment in action. See the map and links below to get basic information about each exhibition site. Data presented here comes from the Lowlands and Benaki exhibitions.

TodaysArt Festival The Hague 2013 | 108 participants
Eye Film Institute Amsterdam 2013 | 56 participants
Nemo Science Museum Amsterdam 2014 | 64 participants
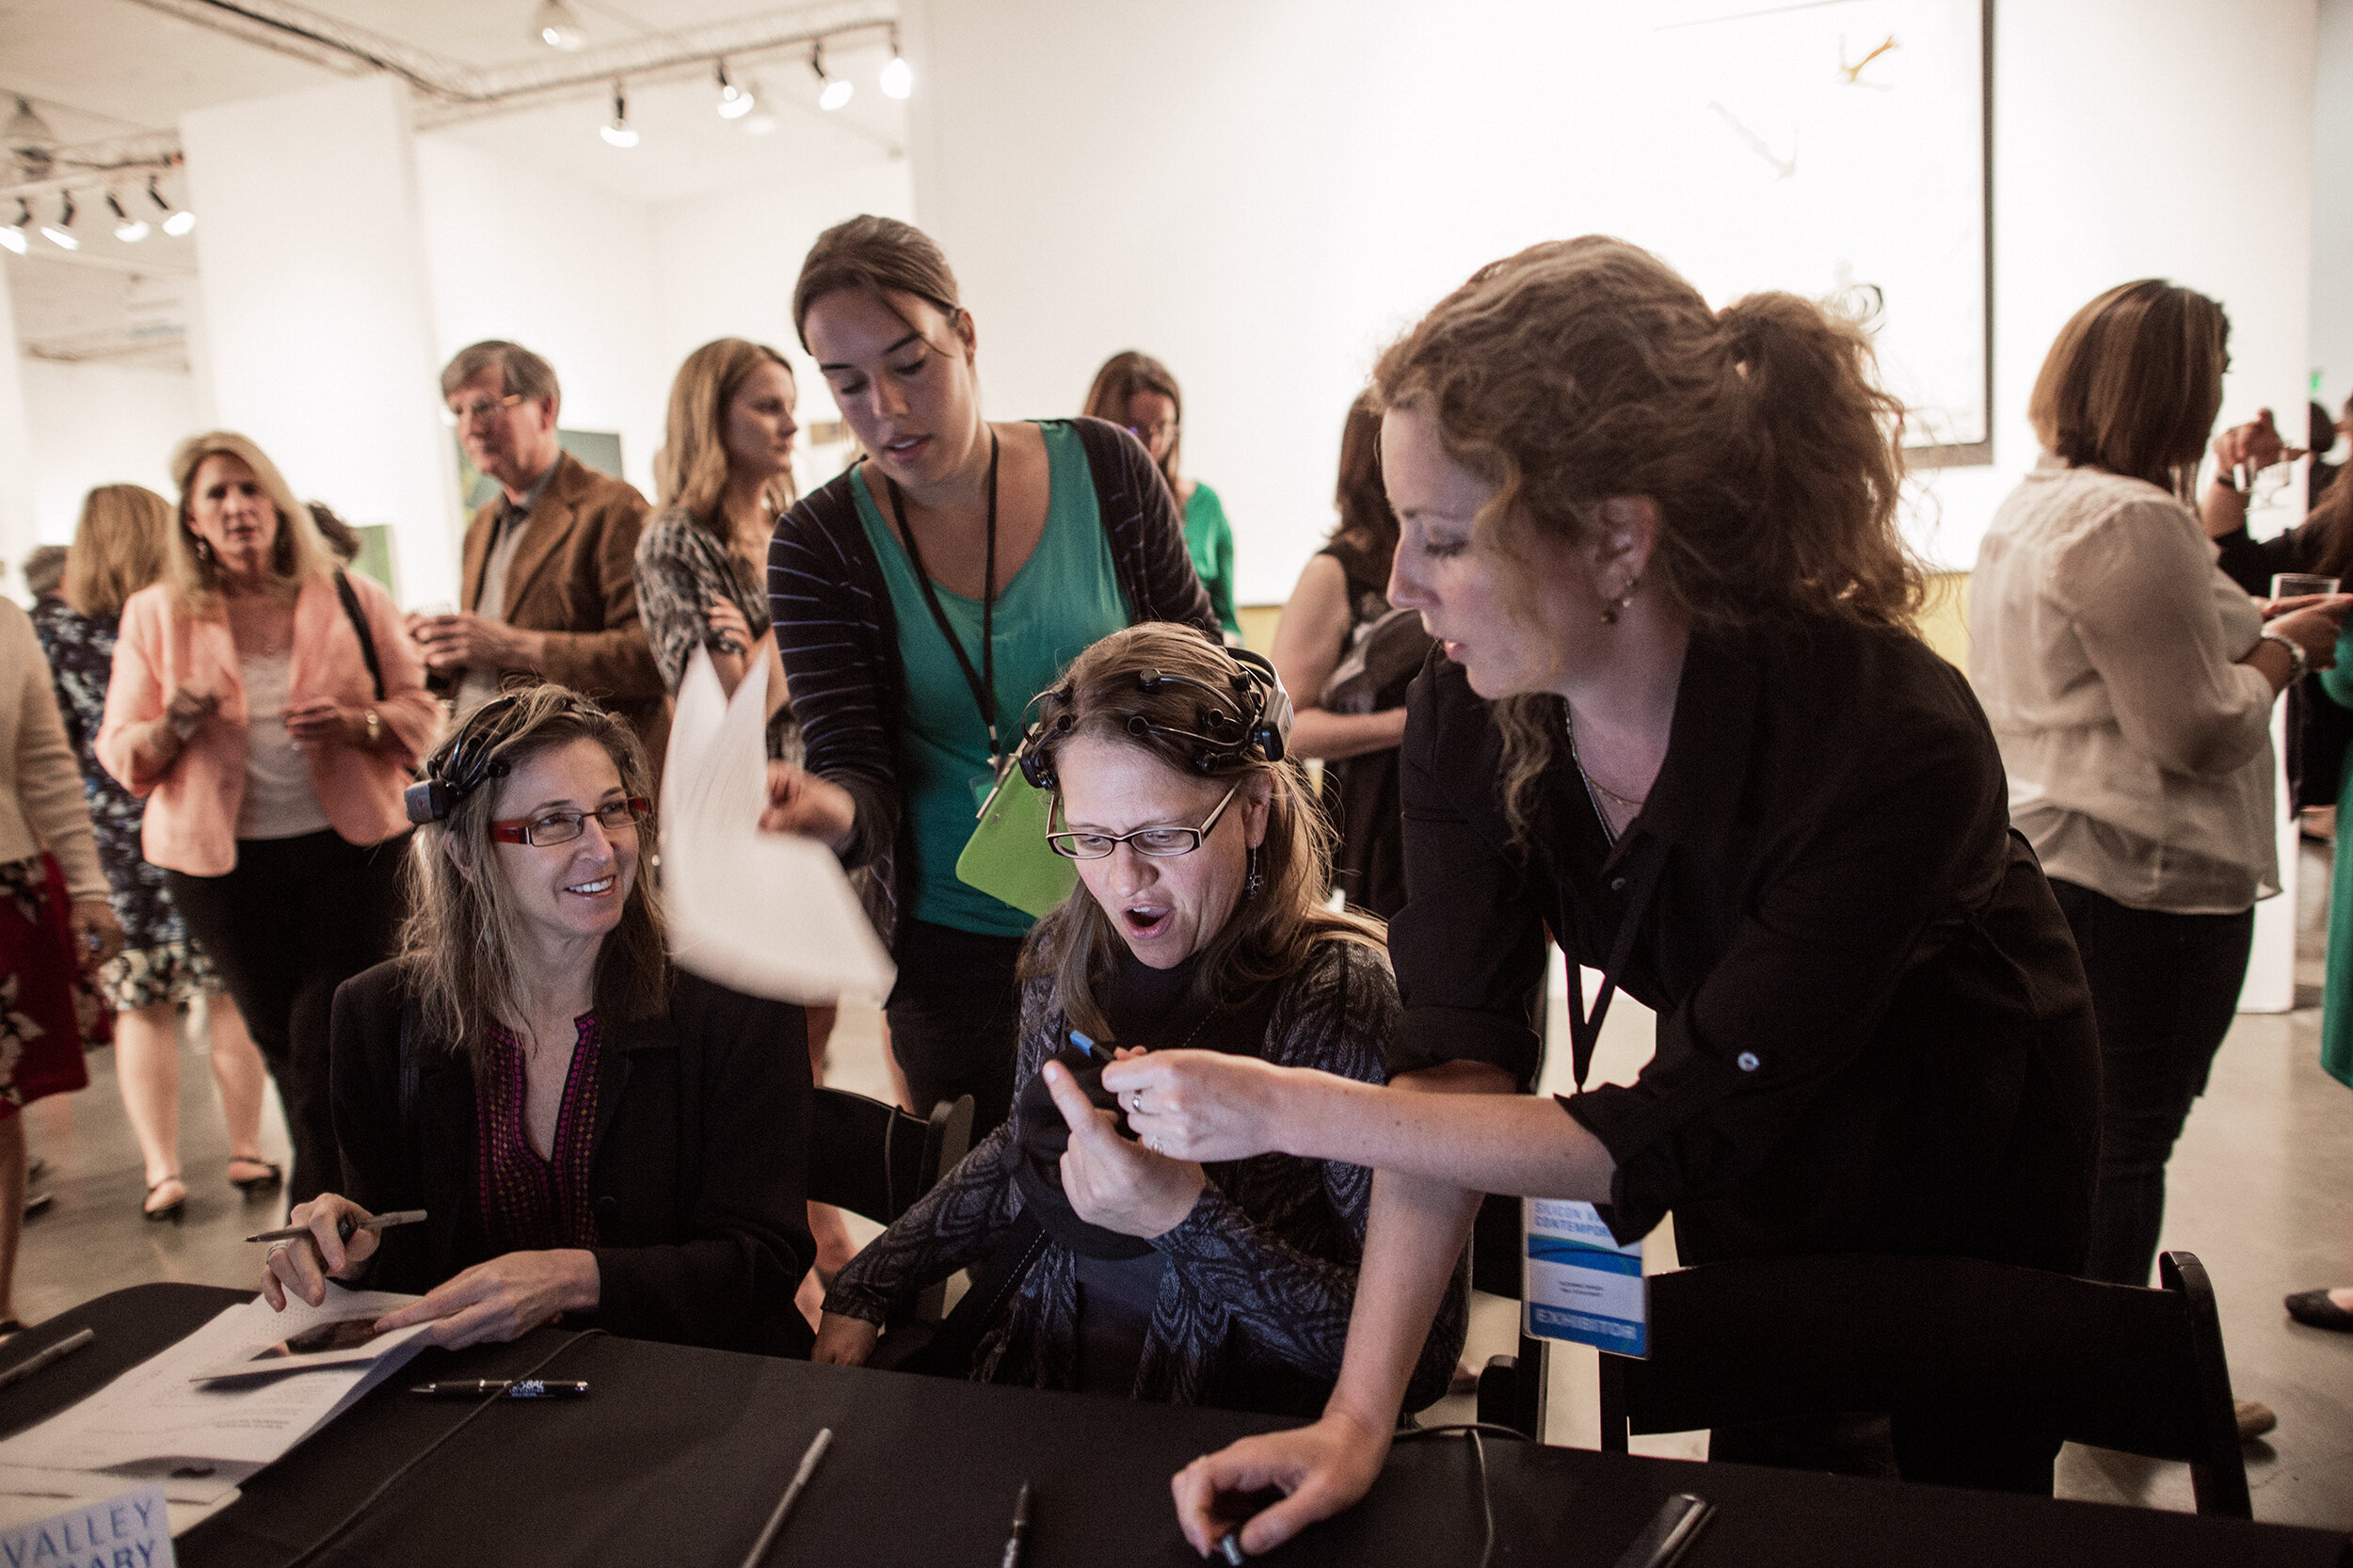
Silicon Valley Contemporary San Jose, CA 2014 | 208 participants
Lexus Hybrid Art Moscow 2014 | ~ 600 participants
Lowlands Festival Netherlands 2015 | 230 participants
Benaki Museum Athens 2016 | 1568 participants
Innovation Expo Amsterdam 2016 | ~ 50 participants
Tivoli/Vredenburg Netherlands 2016 | ~ 100 participants
3LD Art and Technology Center New York City 2016 | ~ 80 participants
FORMS Festival Toronto 2016 | 66 participants
Pioneer Works New York City 2017 | 52 participants
OPUS 1 Festival Merriweather, MD 2017 | ~ 150 participants
Espacio Telefónica Madrid, Spain 2019 | ~ 1470 participants
how does the mutual wave machine work?

Step 1.
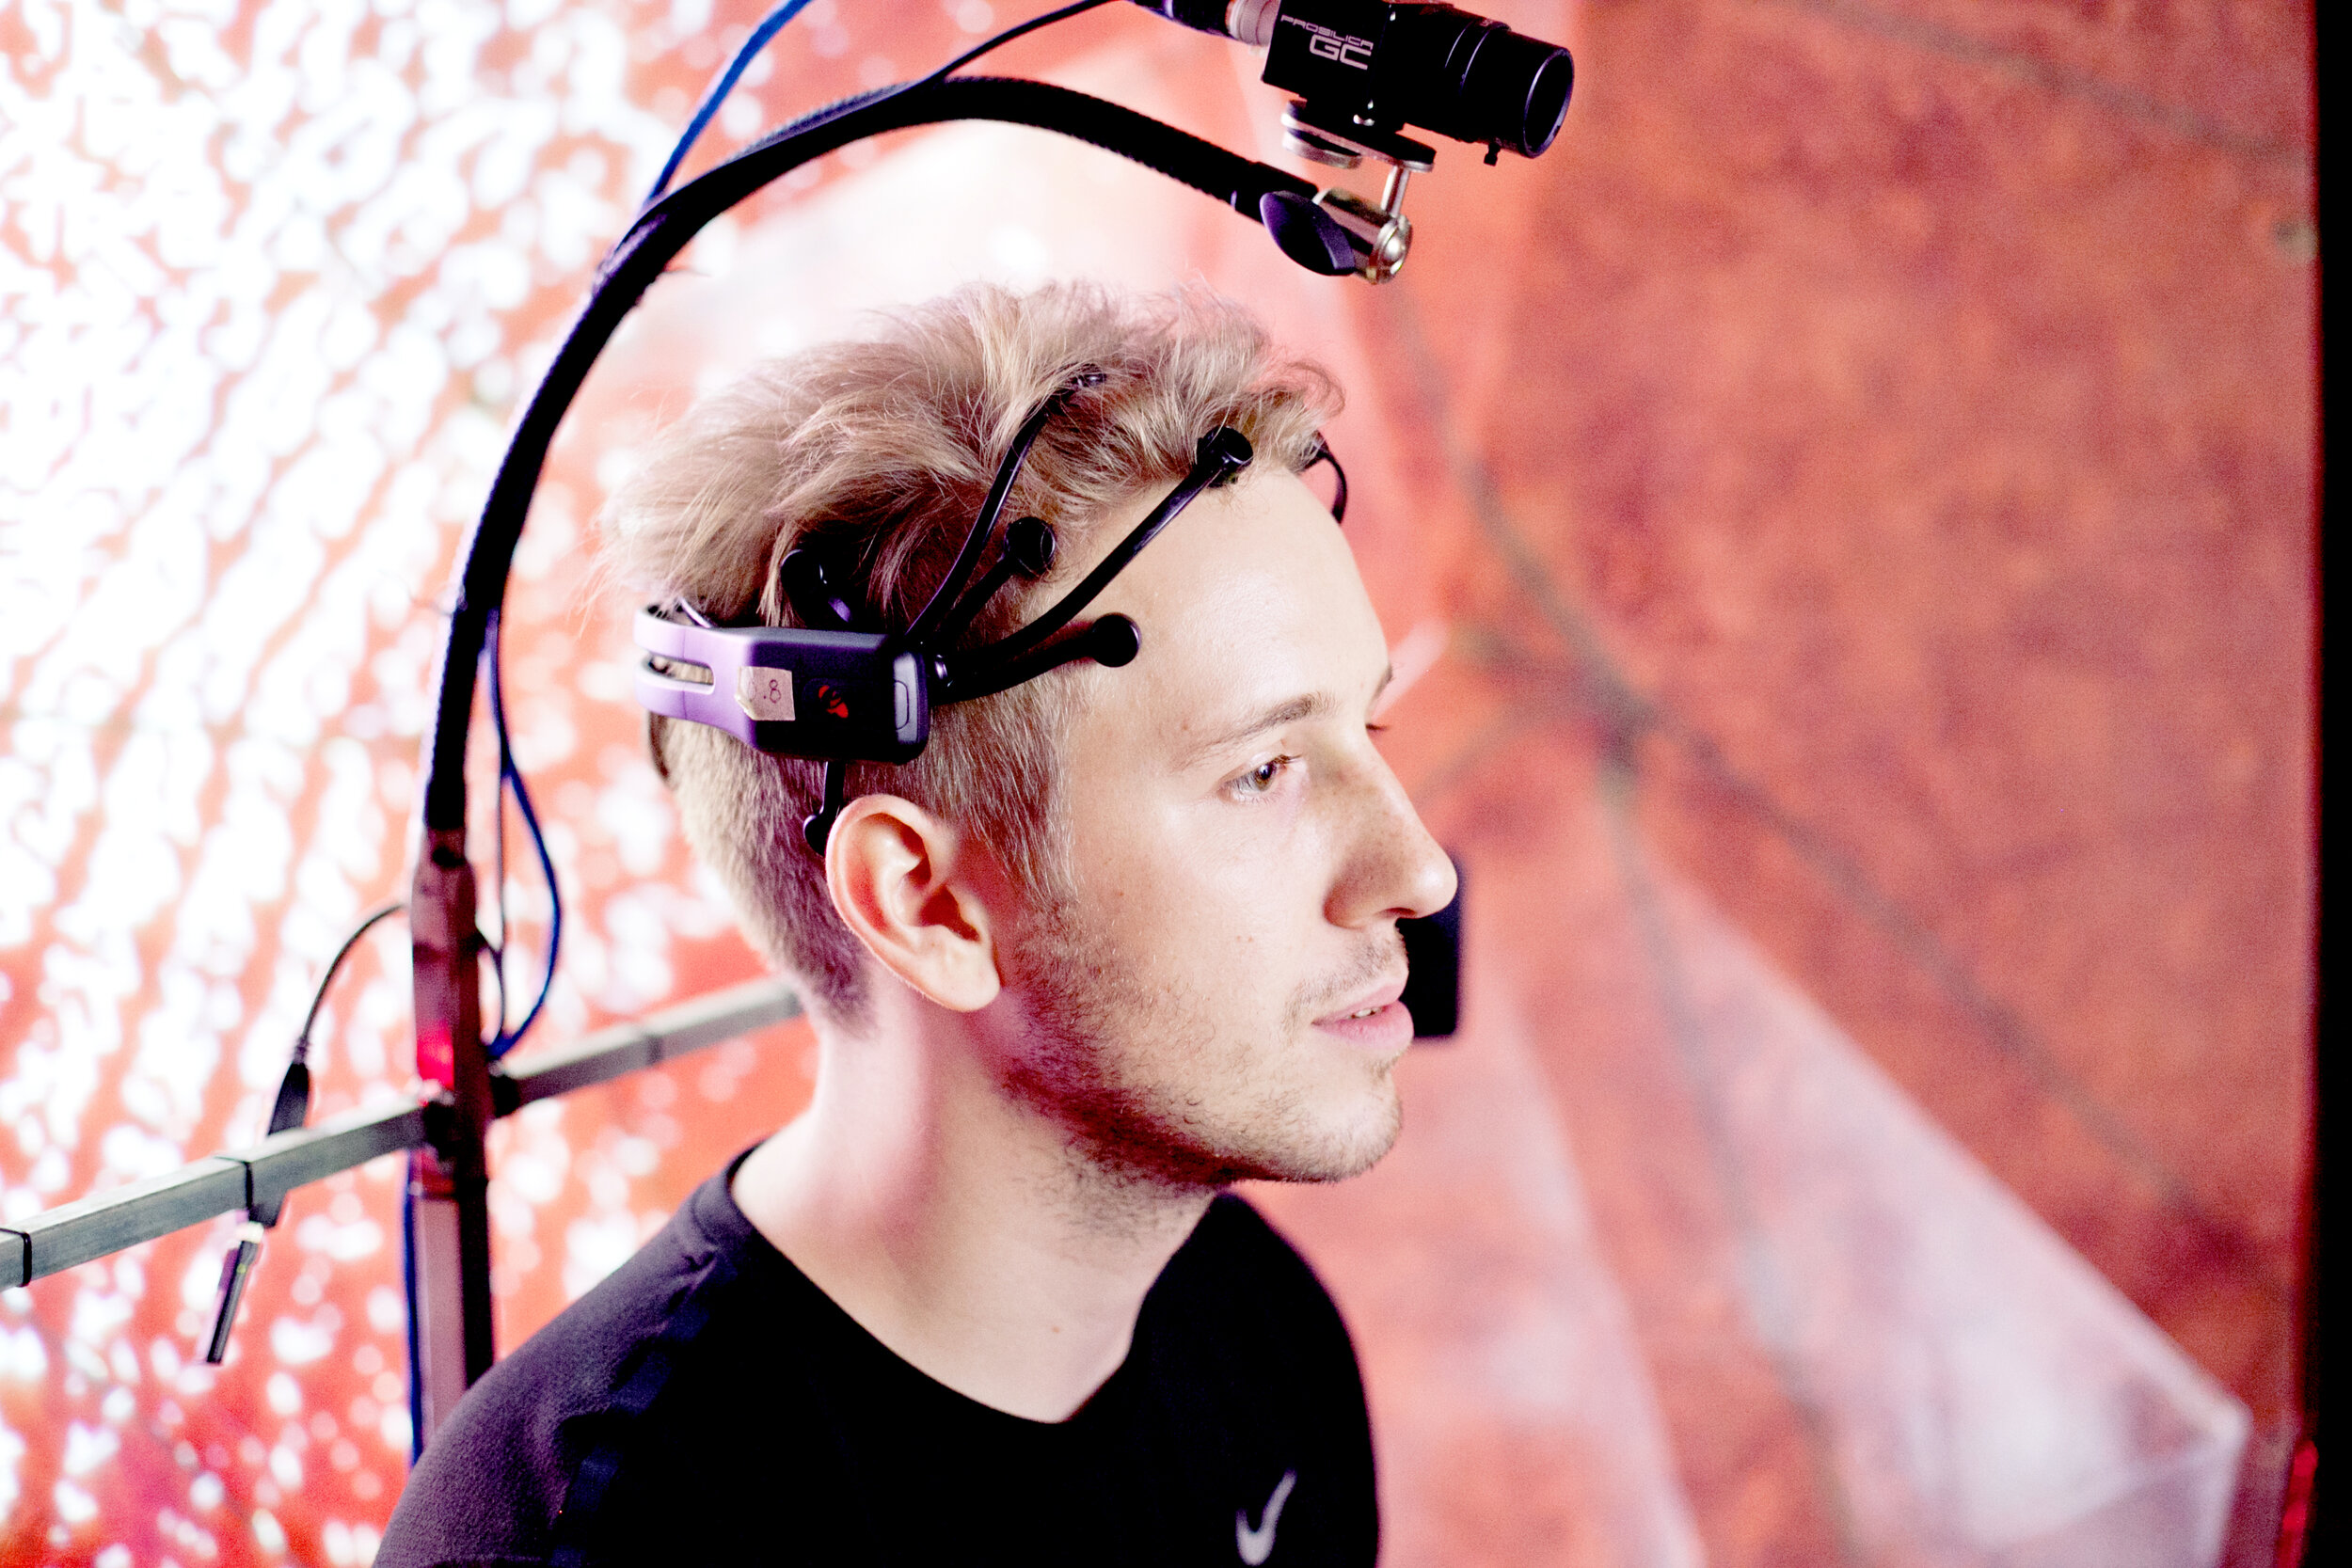
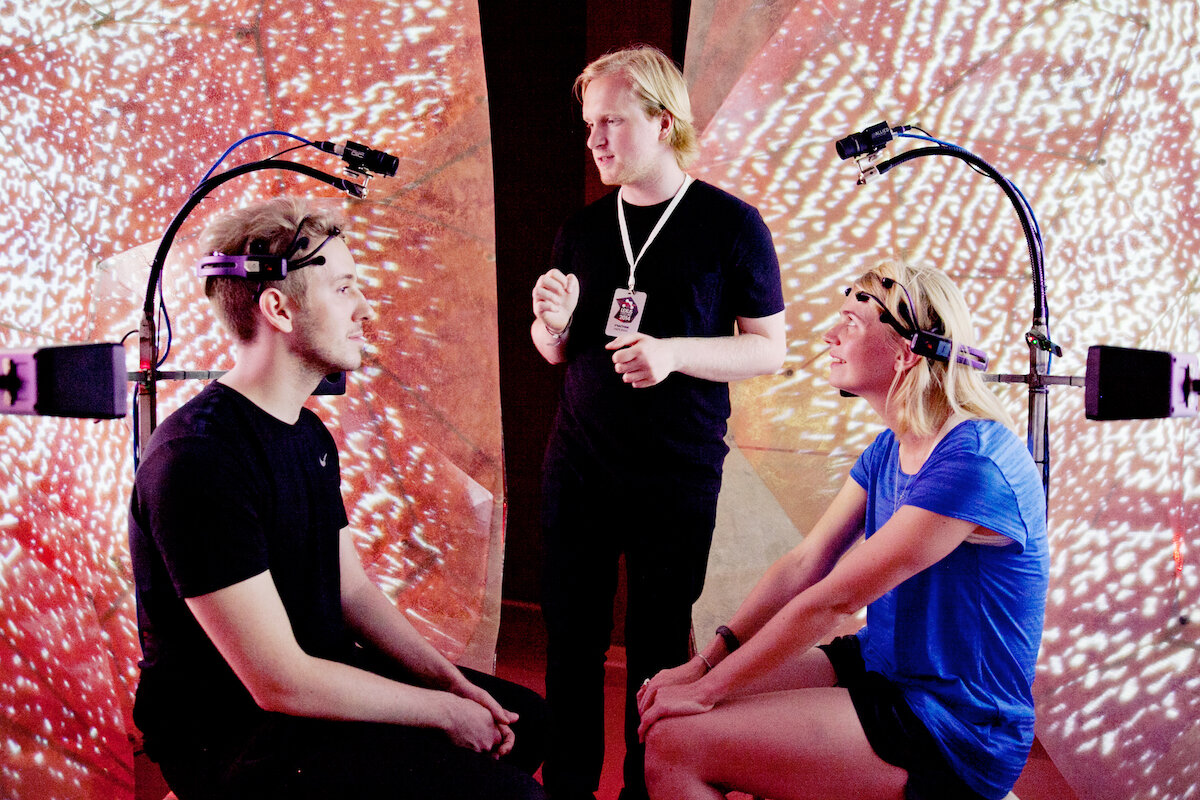
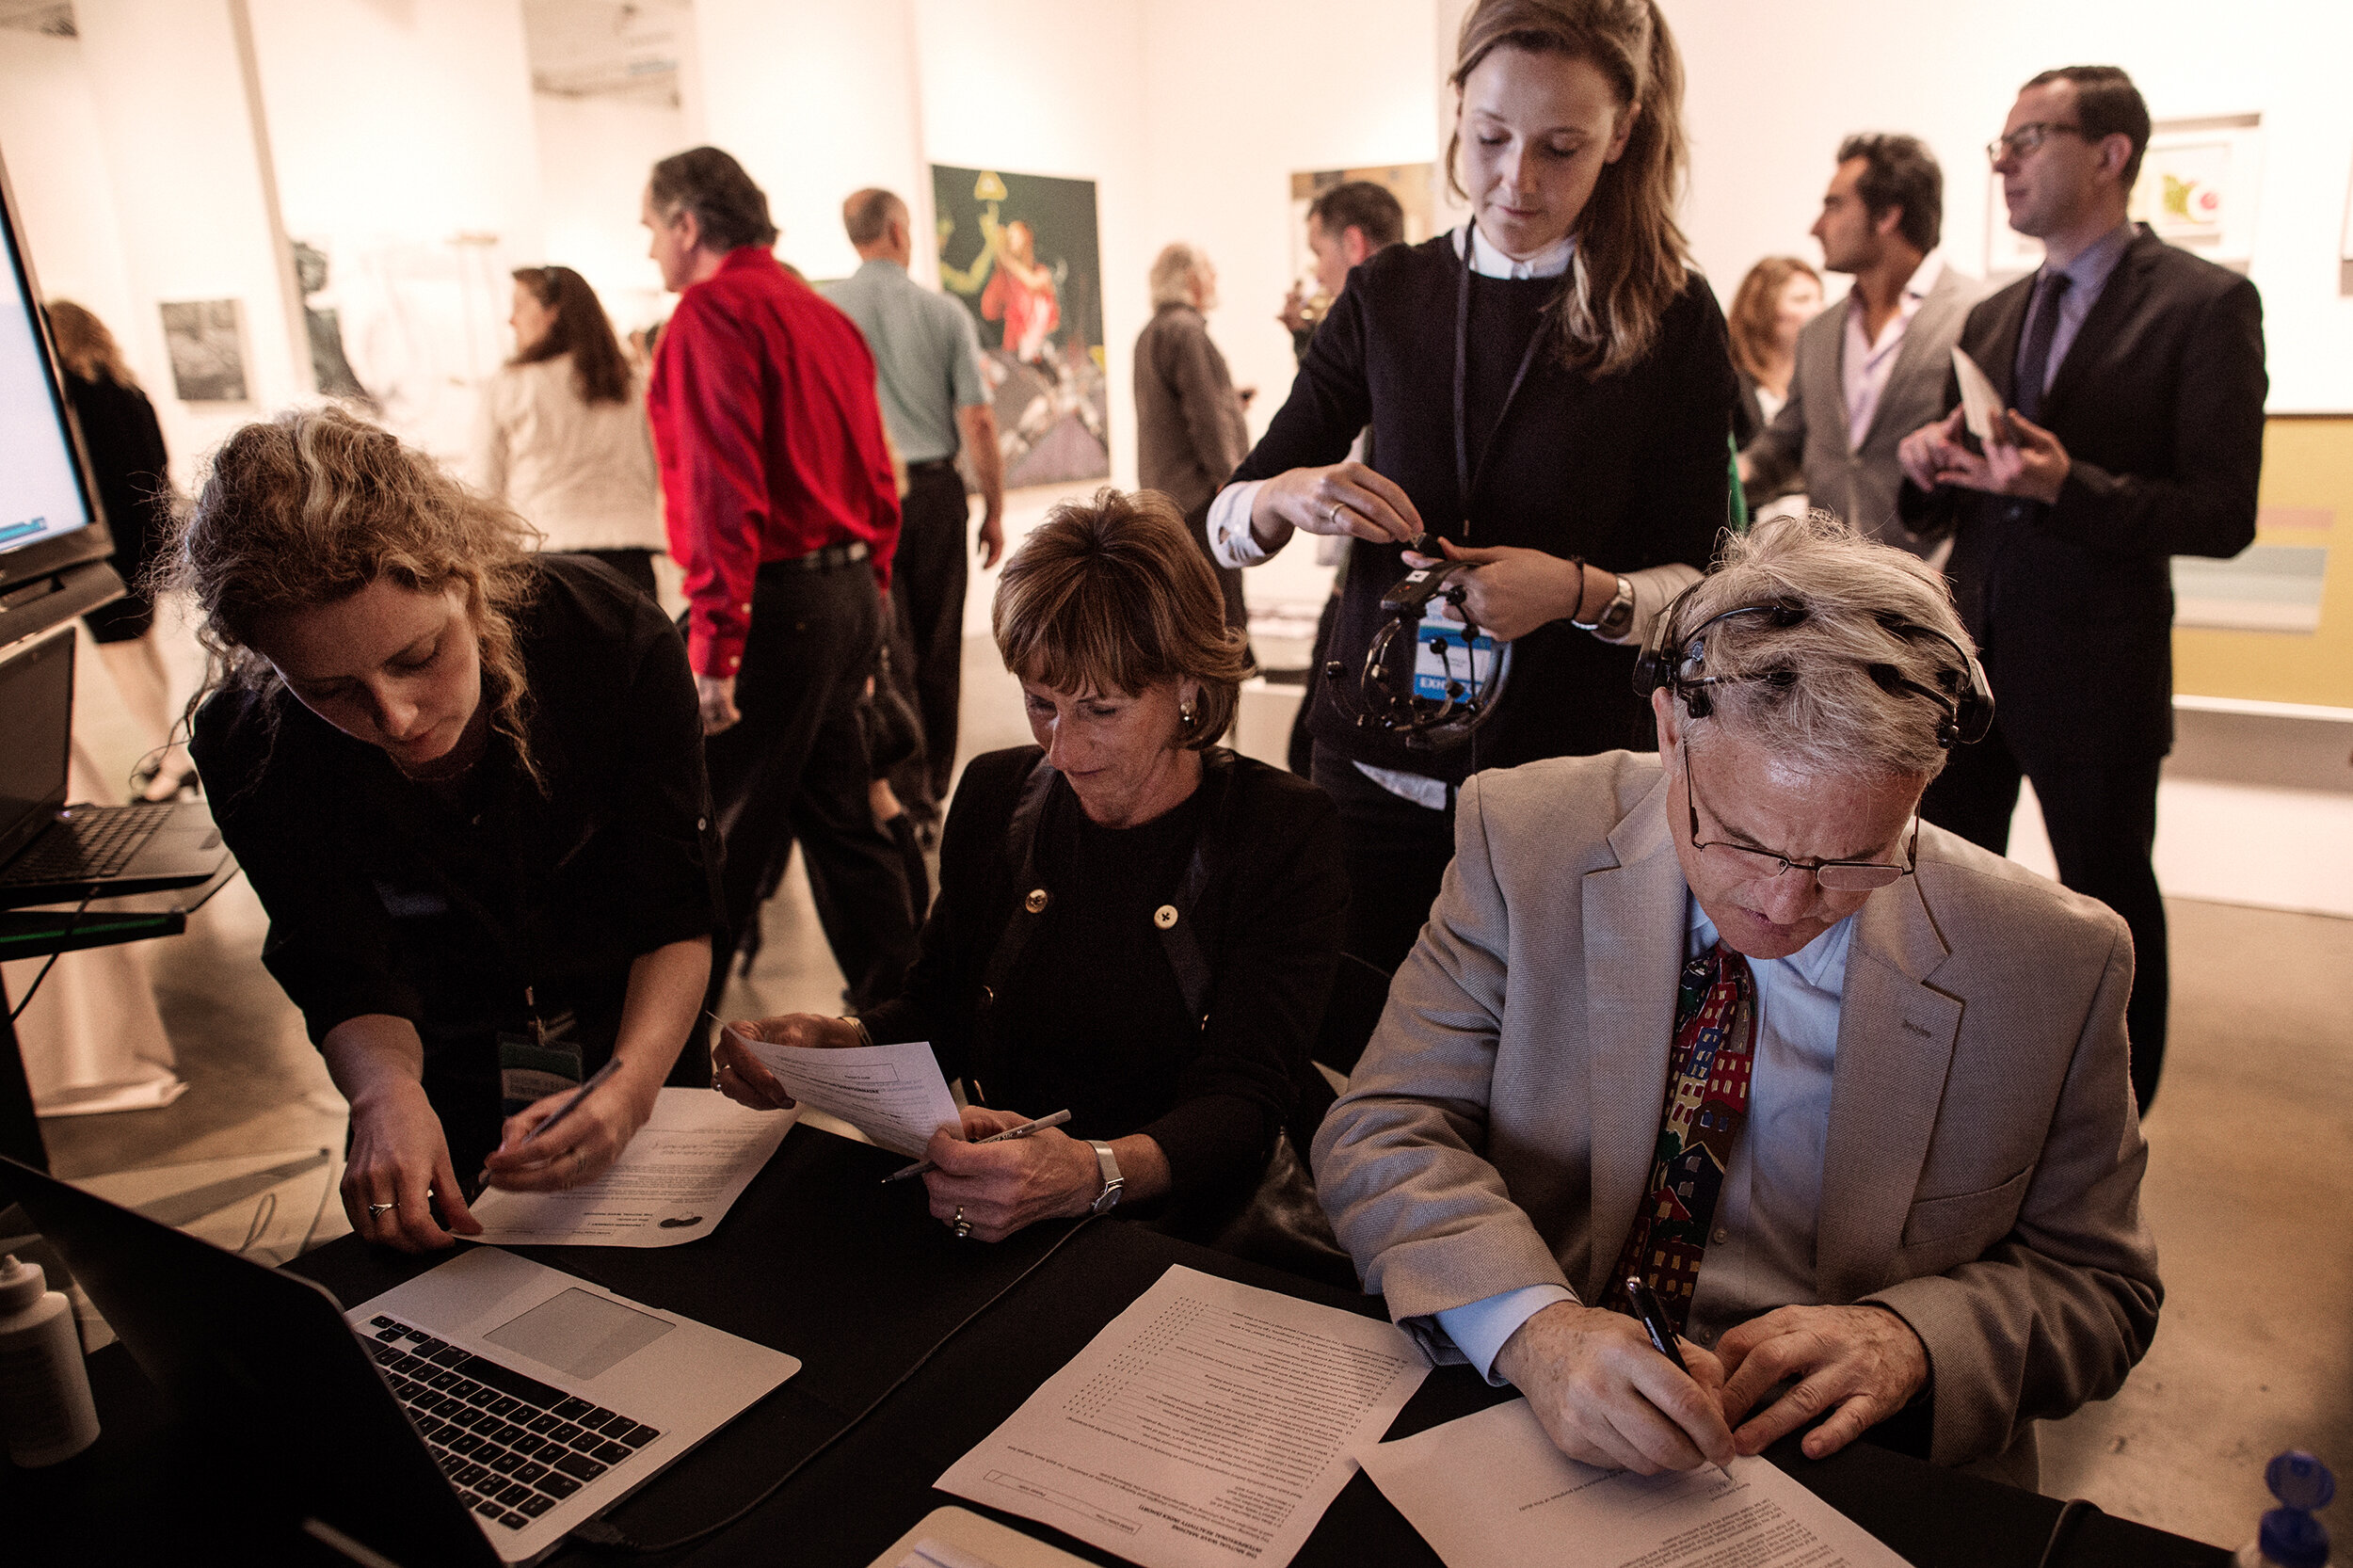
If you volunteer to participate, you are first matched with a ‘brainwave partner’. This can be someone you know or a complete stranger. You are each fitted with an EEG headset and you are shown your own <brainwaves> on a tablet or computer. You can clearly see why researchers usually ask people to sit still: the signal goes all over the place when you move (see <EEG> for more on this).

Step 2.
Right before entering the Mutual Wave Machine, you each fill out a short questionnaire about your relationship, how you tend to behave in specific social situations, and your current mood.

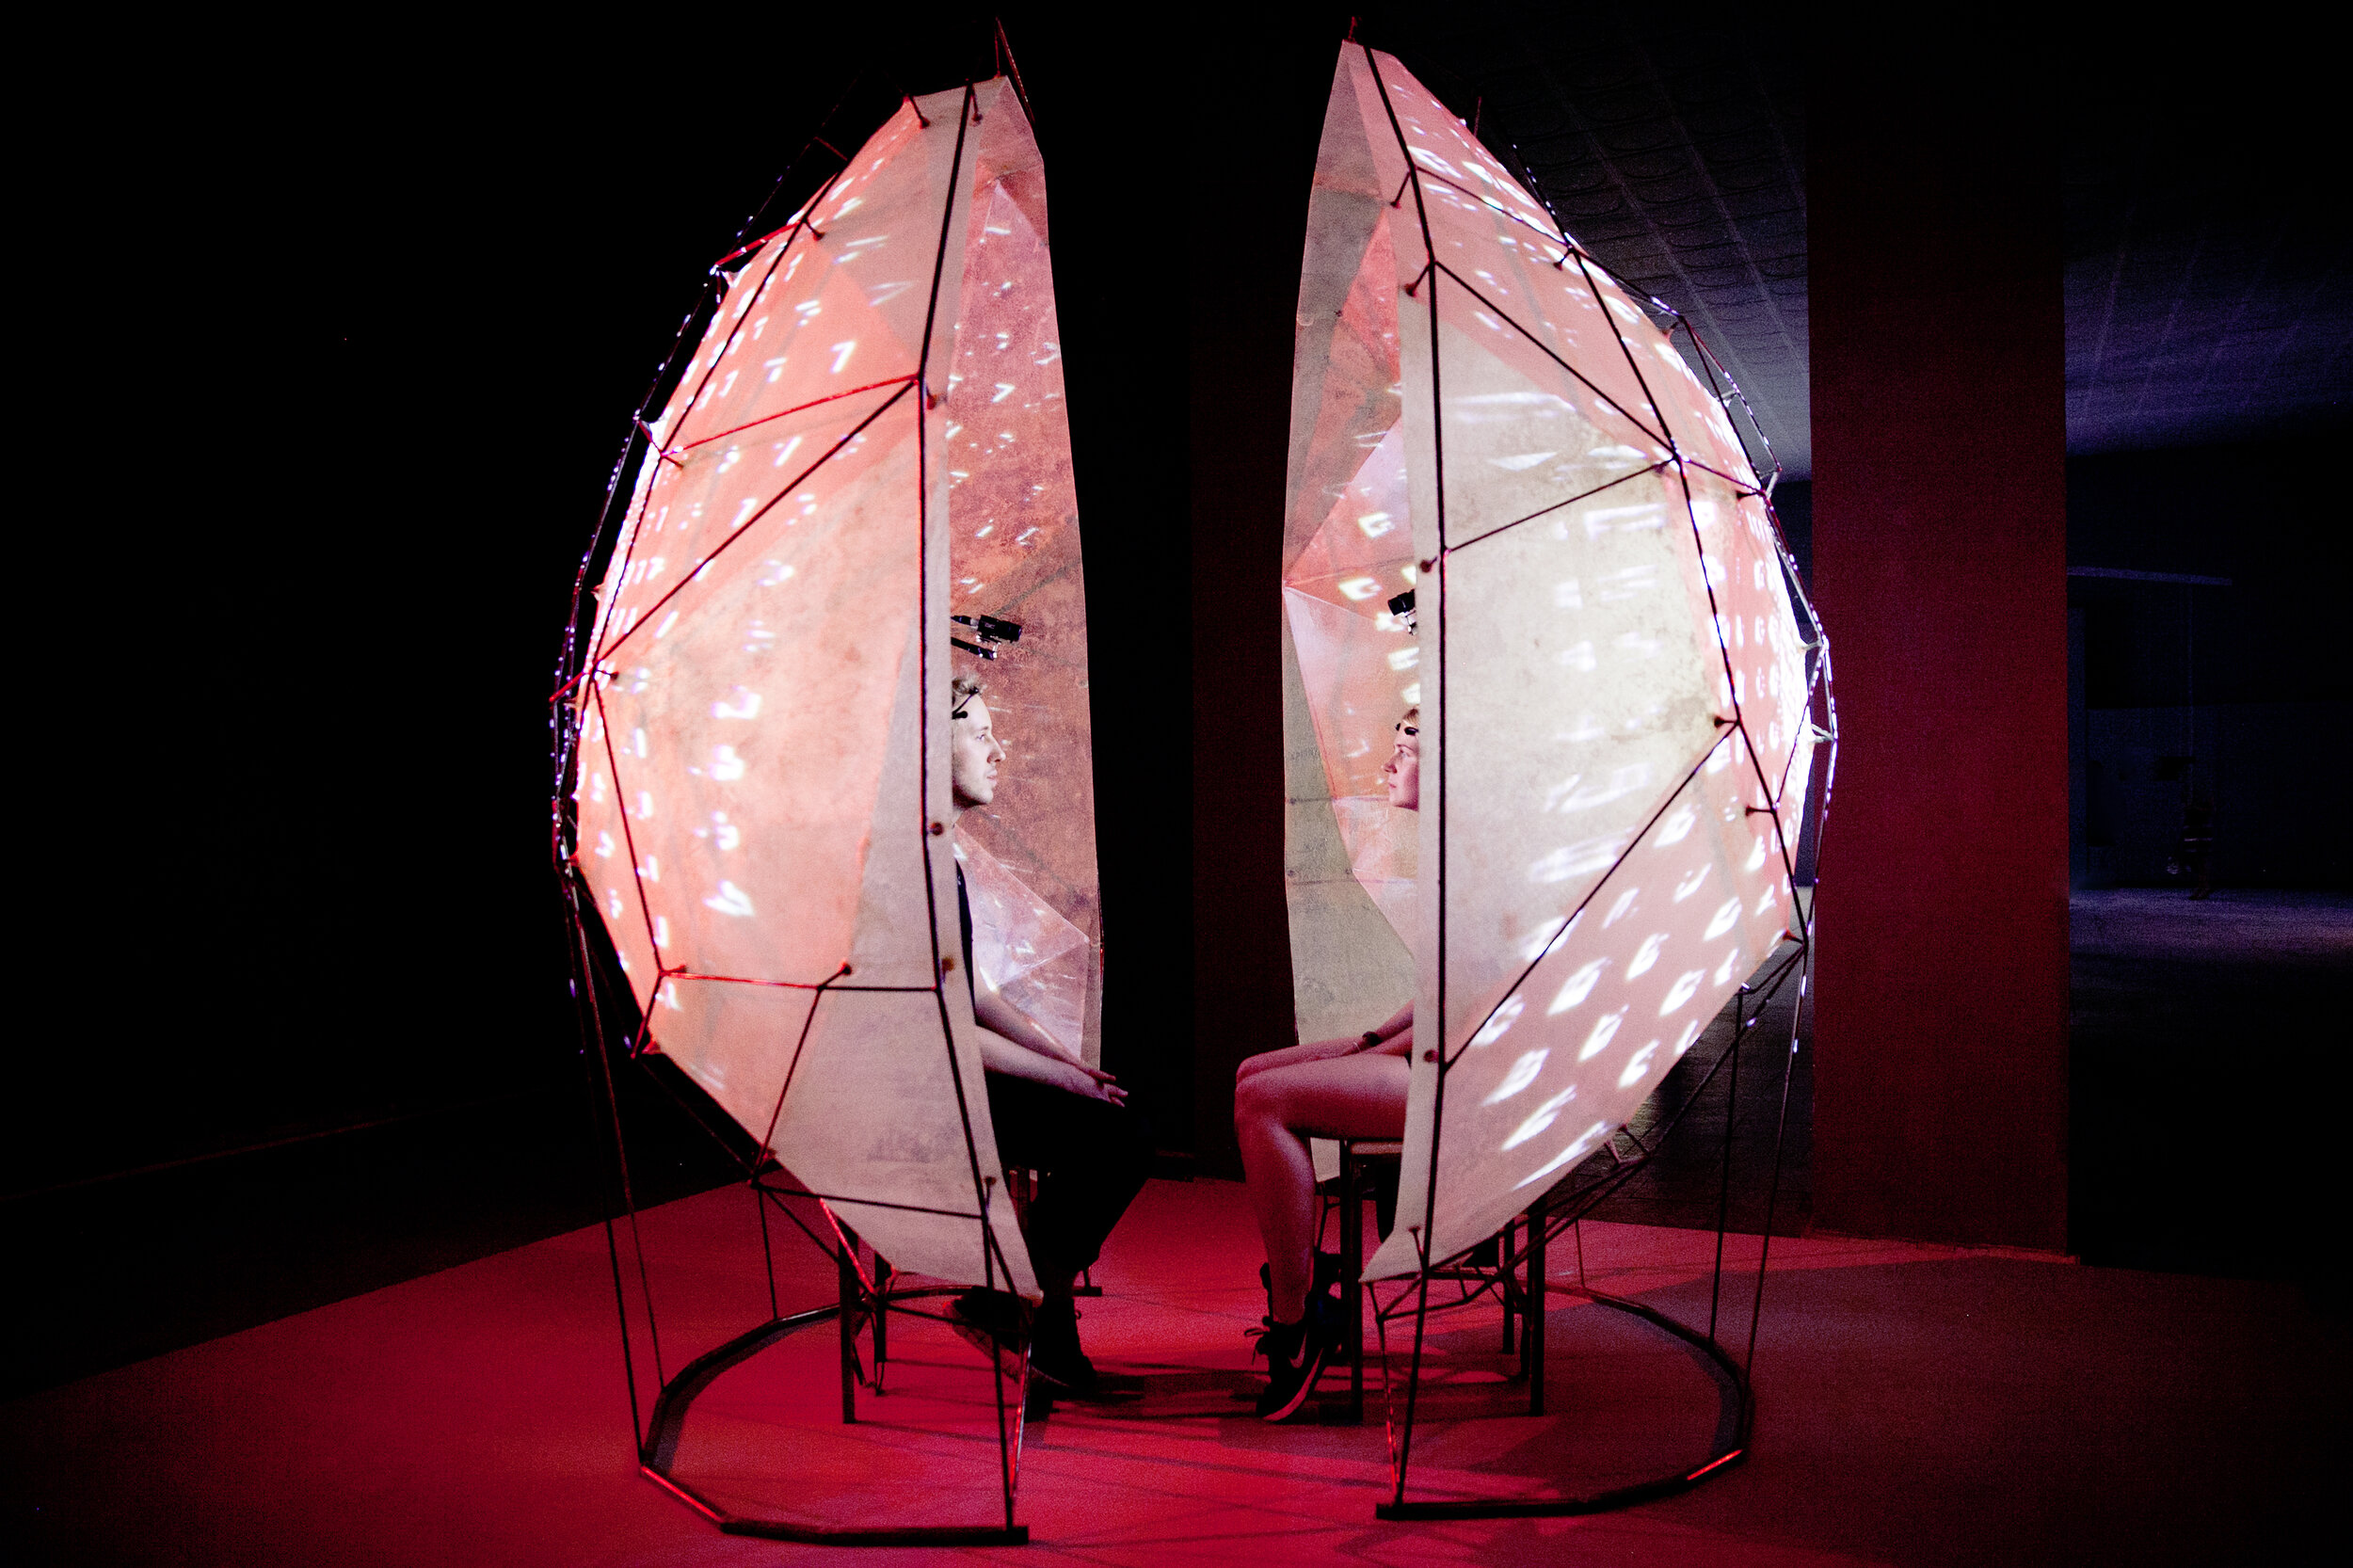
Step 3.
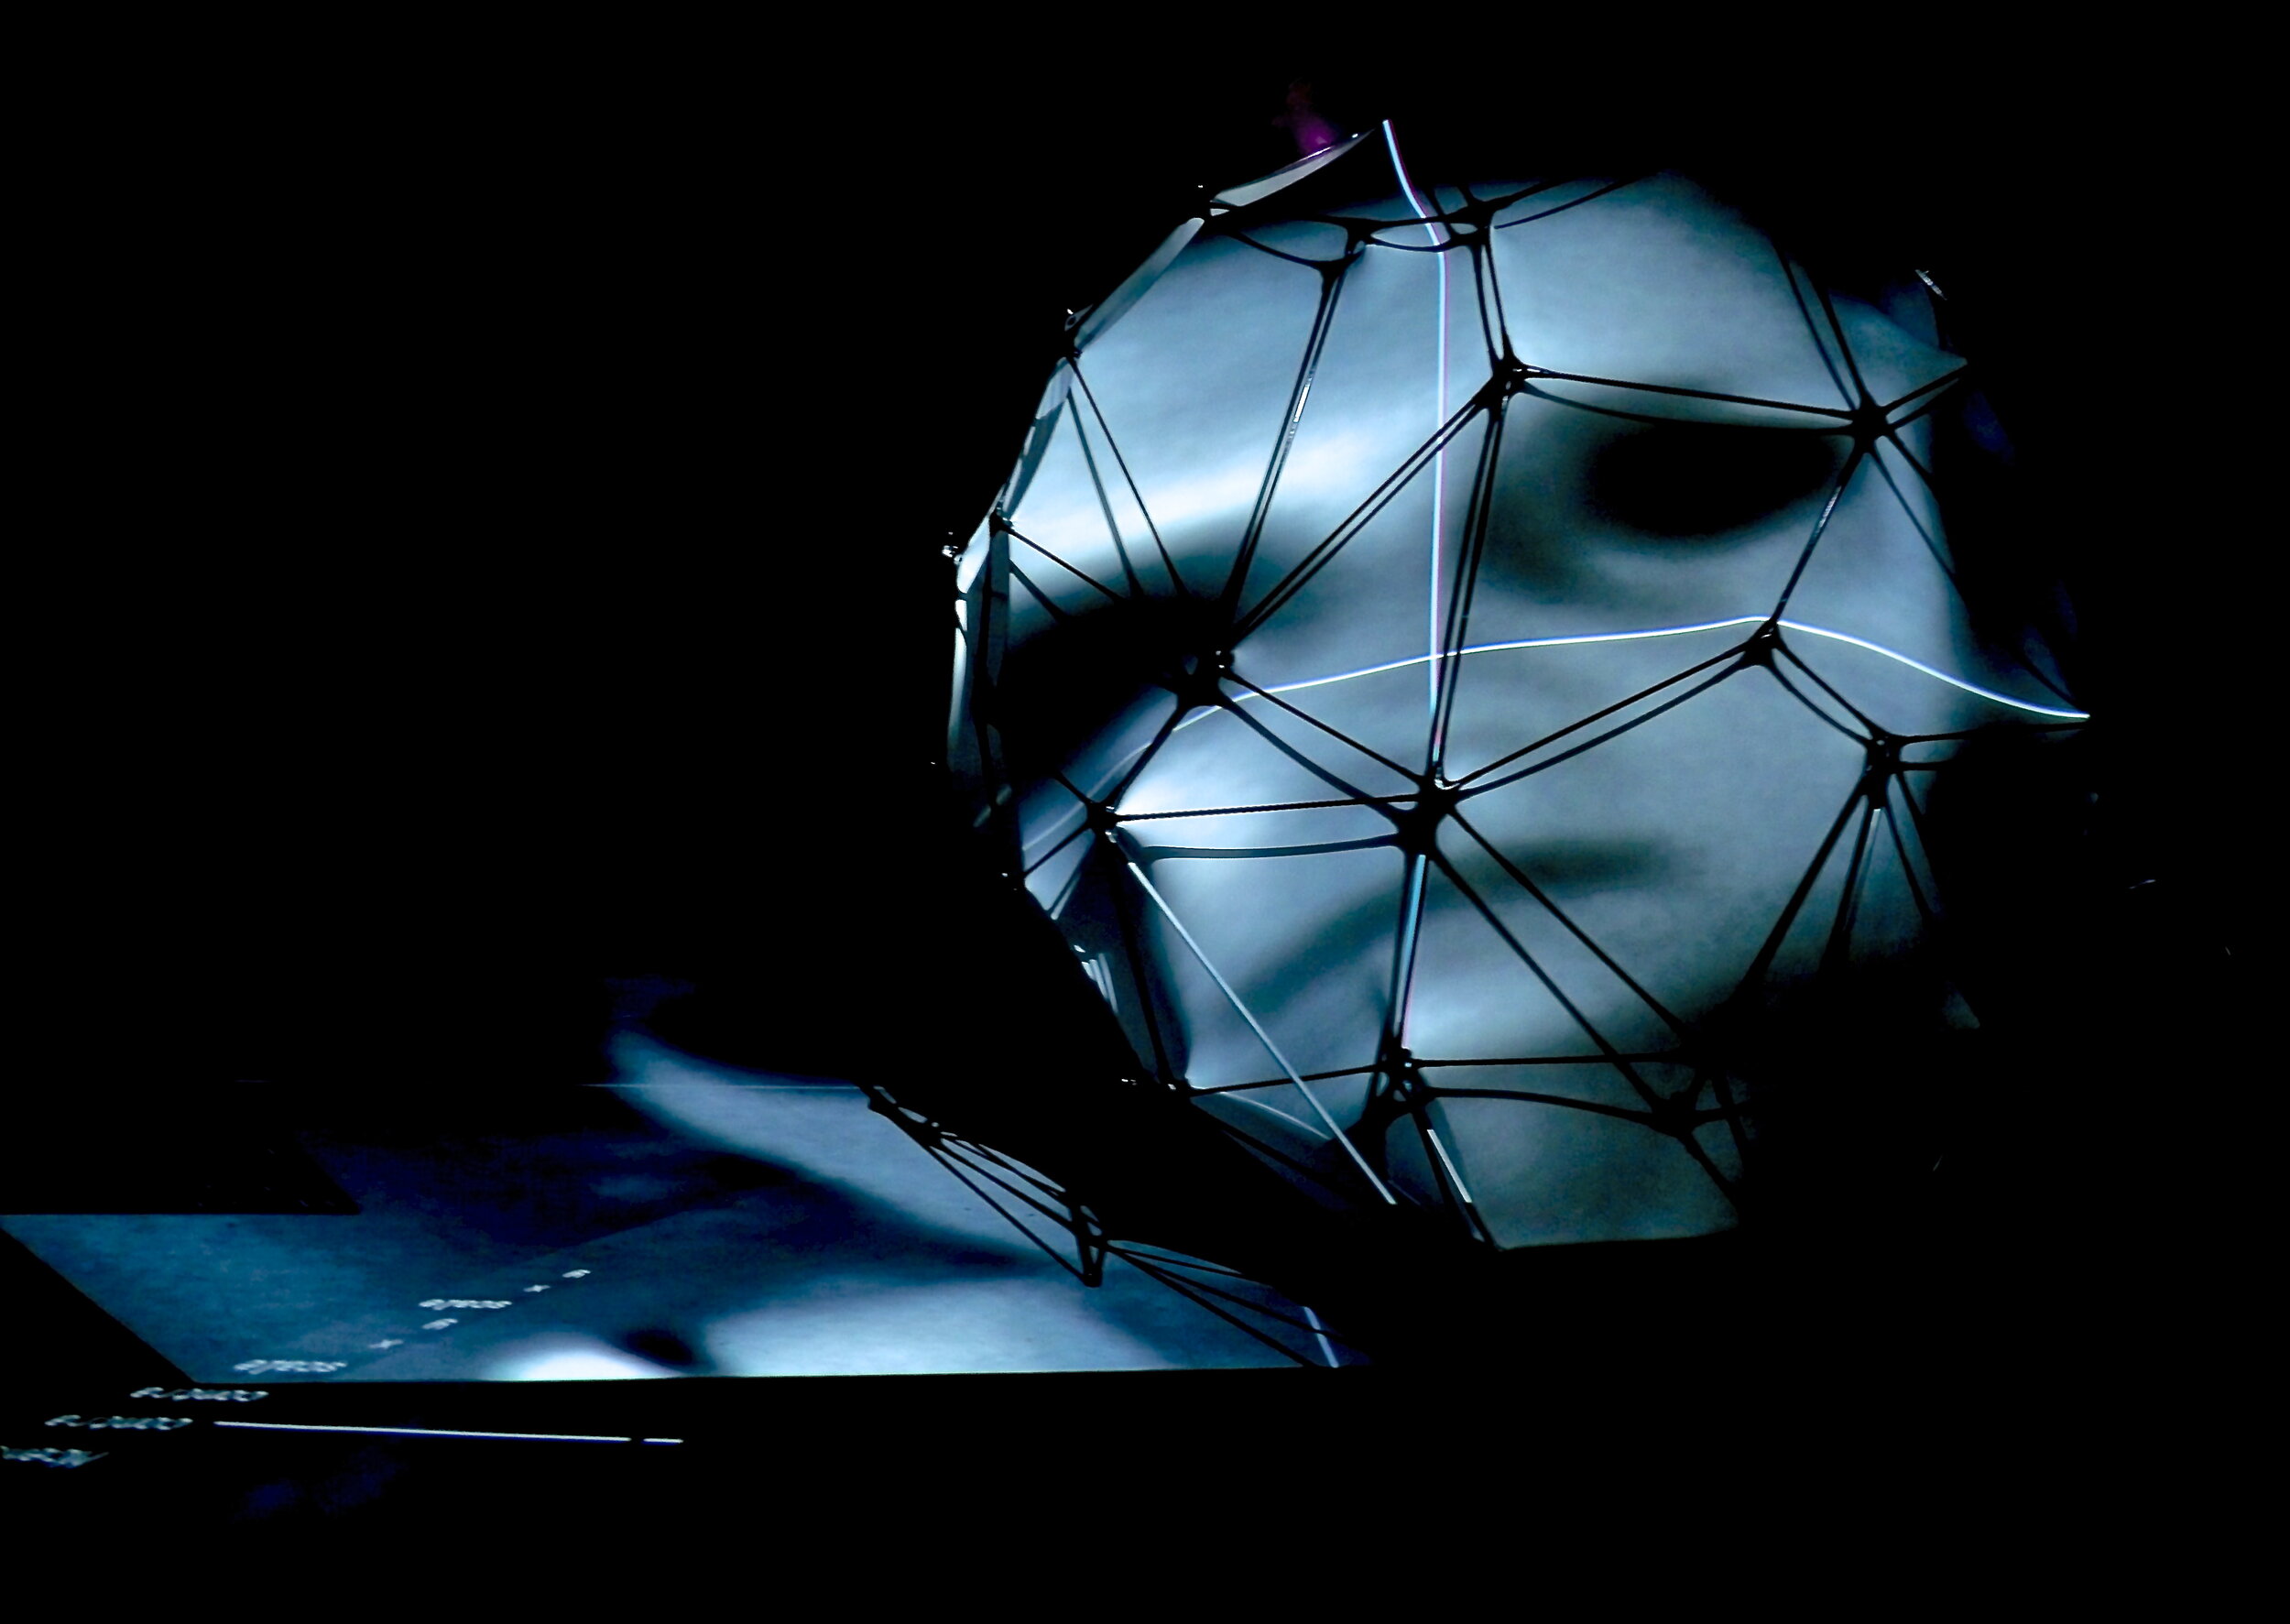
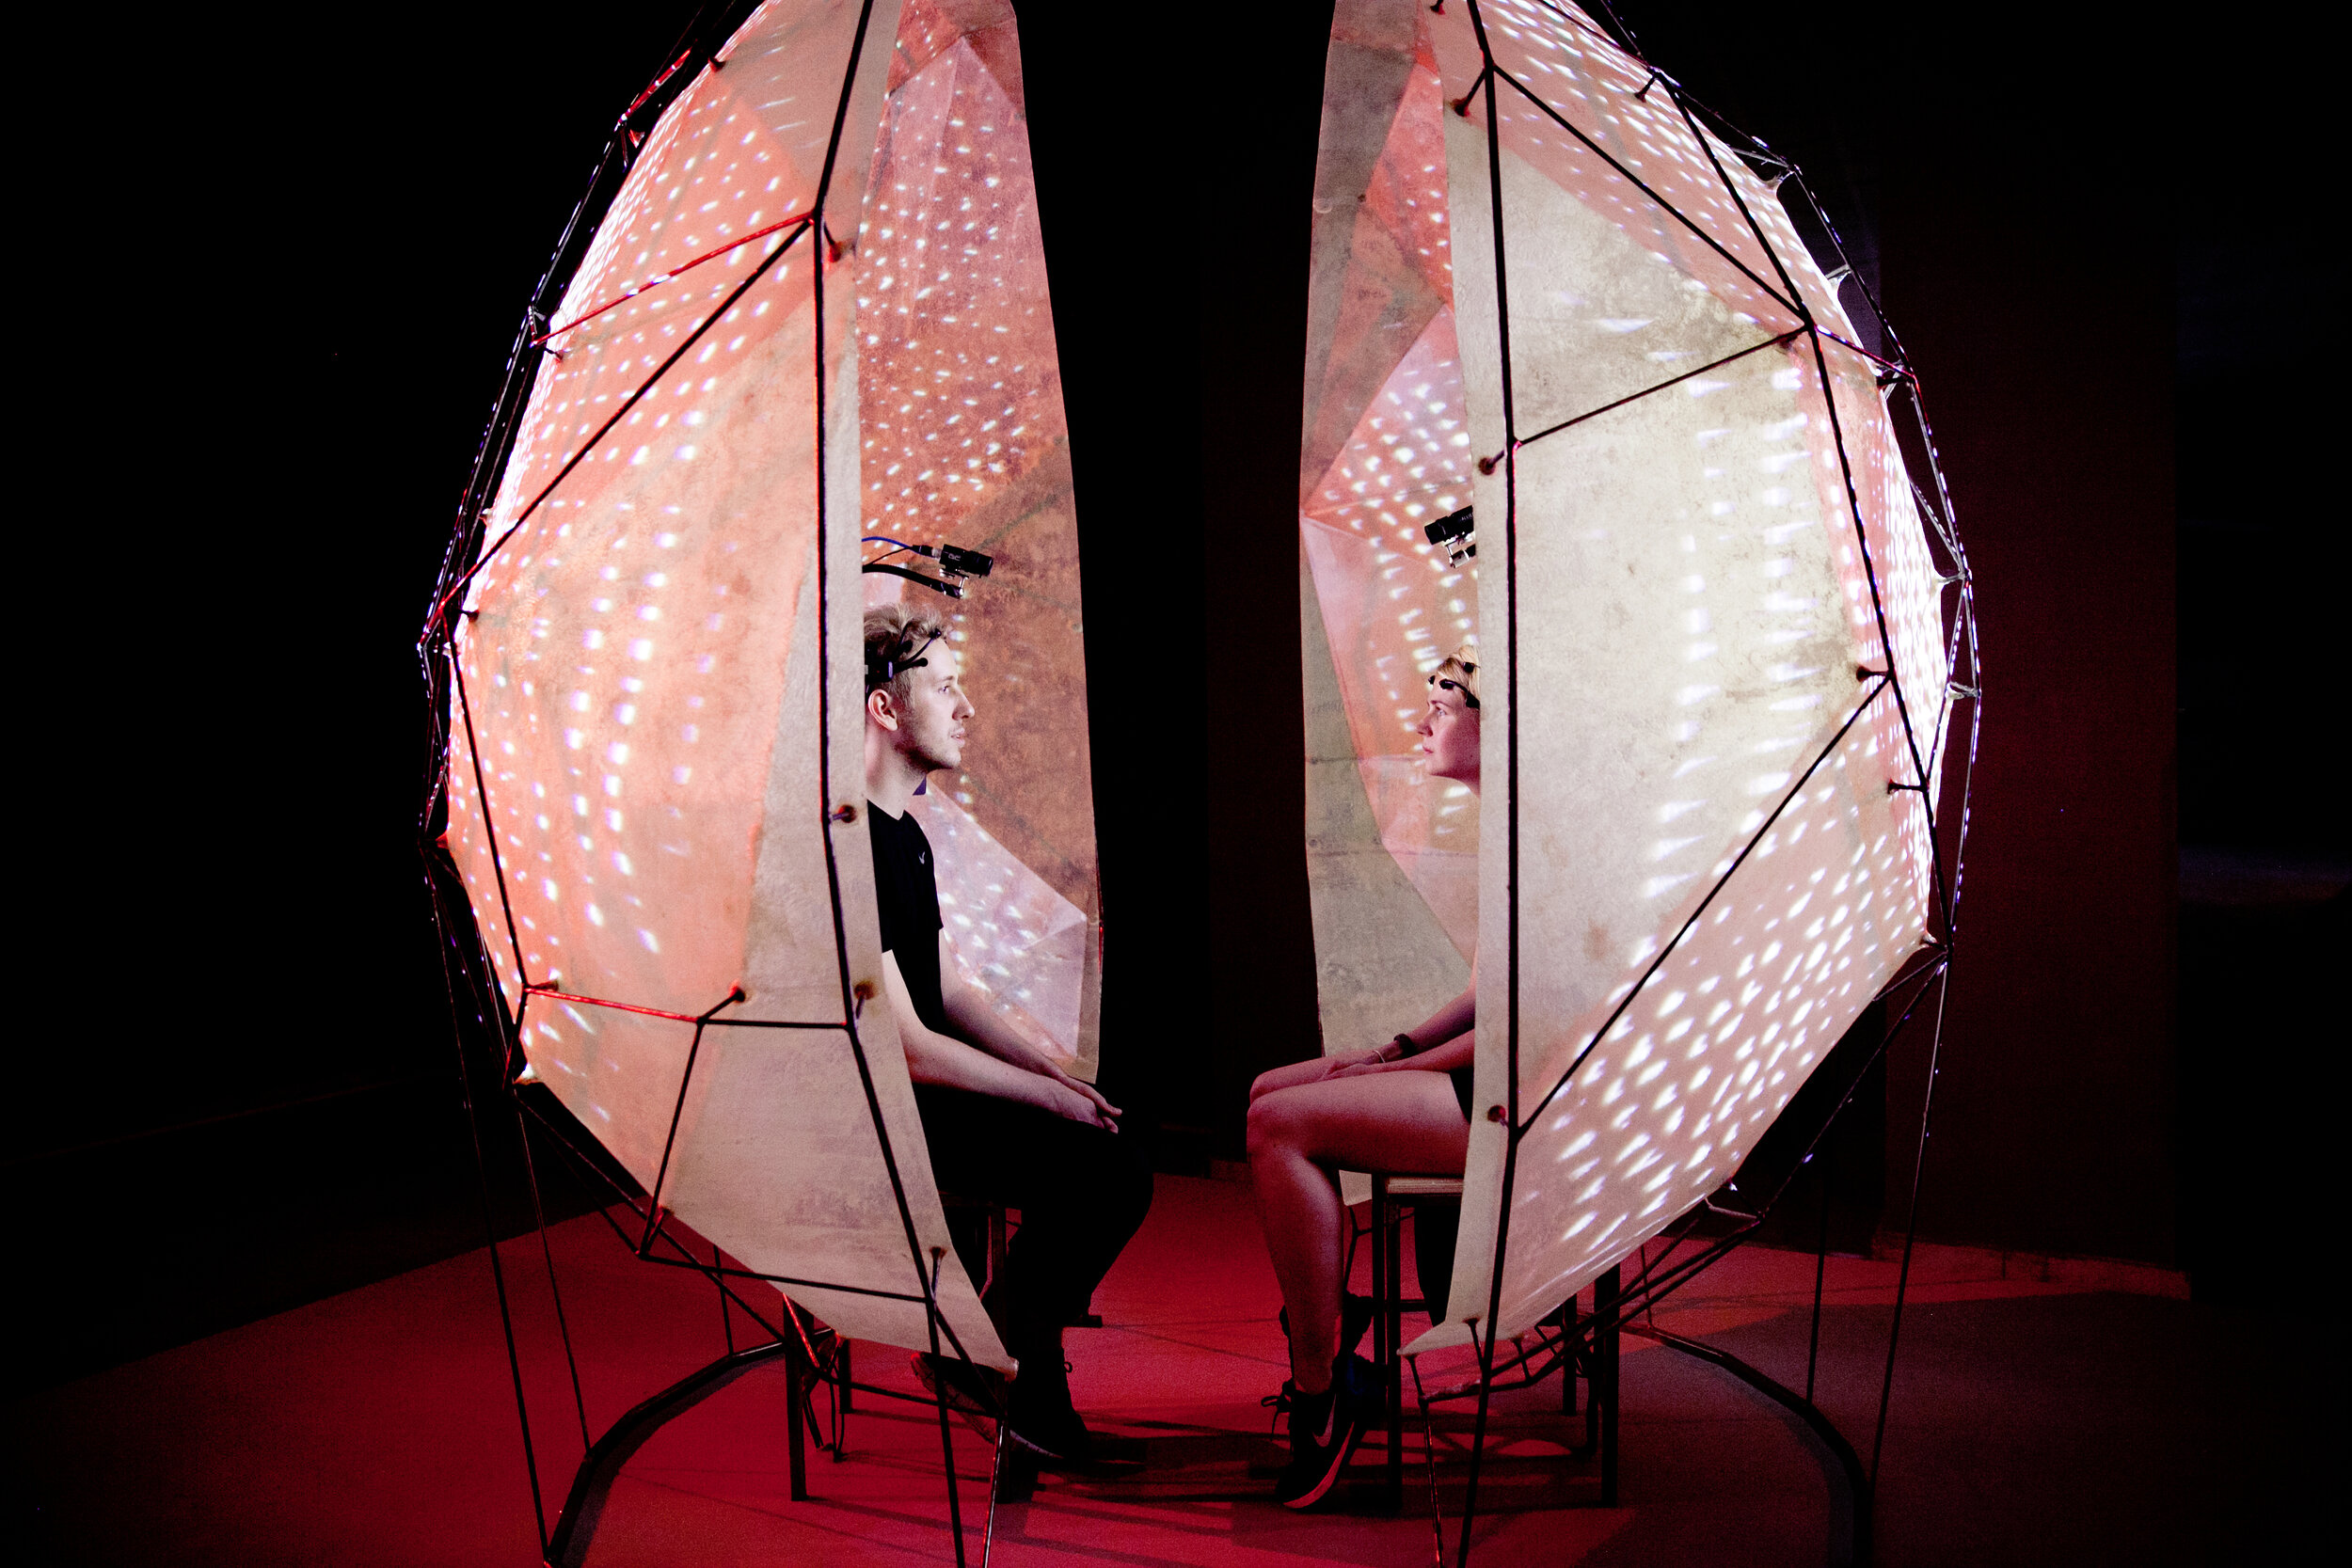
Then you are led into the Mutual Wave Machine. For 7-10 minutes, you will sit opposite your brainwave partner and you will see and hear direct reflections of the correlations of your EEG signal (a proxy for “brainwave synchrony”): more light means more synchrony, and less light means less synchrony. See below for more information about such neurofeedback

Step 4.
After the experience, you will again fill out a short questionnaire.
brainwave synchrony and neurofeedback
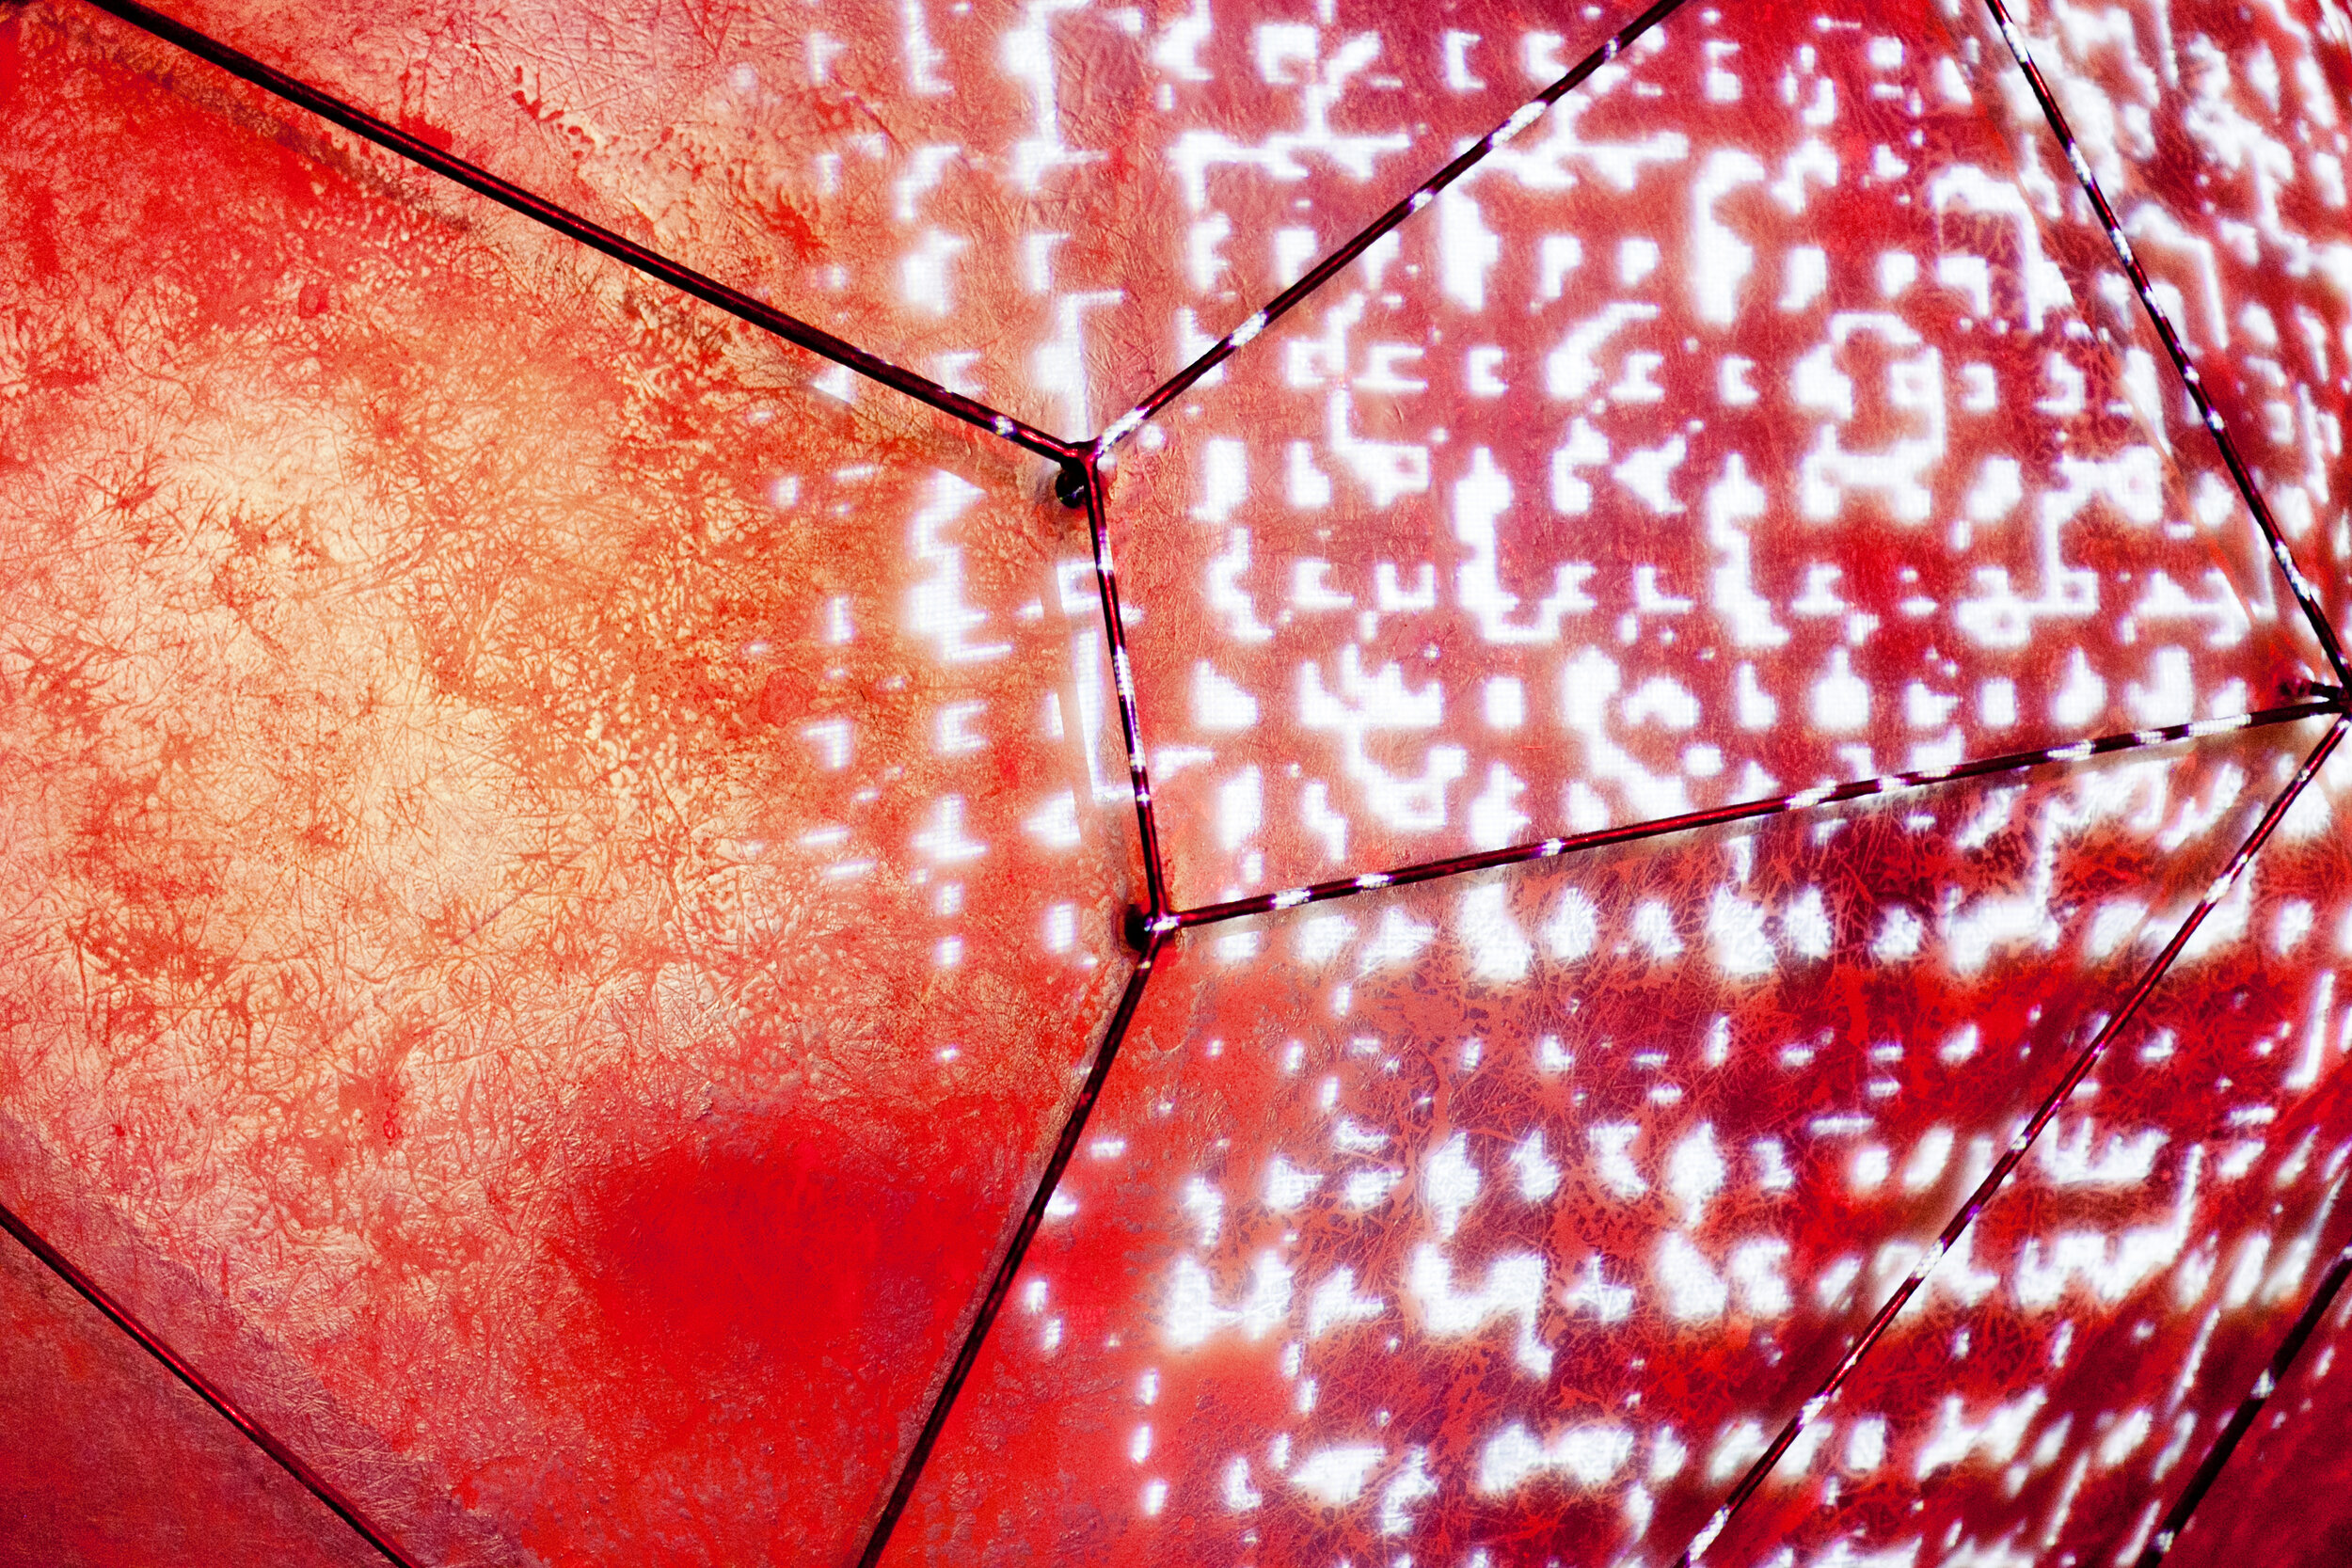
The audio-visual environment displays, in real-time, how correlated the EEG signal is between two participants. As illustrated in the video and graphic, higher correlation values correspond to more light, and vice versa.

Visuals are generated by inter brain correlations: higher correlation values correspond to more light projected onto the sphere.
We wanted to know if showing participants their EEG correlations in real time (“neurofeedback”) might have a positive effect on their experience: Do you feel more connected to the other person? Does synchrony-based neurofeedback increase your brain synchrony? We also asked whether the feedback itself was ‘meaningful’: does it work only if it is real? Or is what matters whether people believe that what they see tells them something about how well they are connecting?
As it turns out, seeing is believing: Brain synchrony increased over time if participants were told that the audiovisual environment reflected their ongoing brain synchrony, even if the feedback was ‘fake’. If you are interested in the notion of neurofeedback, see some discussions here and here.
Now let’s discuss our findings more in detail!
what did we find?
does your social bond affect synchrony?
Our main research question was whether feeling in sync with someone also syncs up your brainwaves with that person. So, we asked all participants to indicate how close they felt to each other (Social Closeness) and how long they had known each other (their Relationship Duration)
brainwave synchrony & social closeness
Each participant was shown a series of (partially) overlapping circles, and was asked to select which degree of overlap between their “self” and “other” circles best represented his/her sense of closeness toward the other person.

In the graph above, each dot represents a pair of participants. If you participated in the Mutual Wave Machine, you and your “brainwave partner” may be one of those dots. The dots on the bottom represent pairs who felt less close to each other. Dots on the top of the graph represents pairs who felt very close to each other. Dots on the left of the graph represent pairs with low levels brain synchrony, pairs on the right of the graph represent pairs with relatively high levels of brain synchrony.
Be sure to check out Carolyn Parkinson and Thalia Weatley’s fMRI work showing that when you watch video clips, your brain responses are similar to those close to you in your social network.
brainwave synchrony & relationship duration
Participants were also asked how long they had known each other. Across ~400 pairs, we observed an overall pattern where pairs who didn’t know each other showed less brain synchrony than pairs who knew each other well.
But, just like in social closeness, not all strangers showed less brain synchrony than pairs who did know each other, and not all pairs who knew each other for a long time showed more brain synchrony than strangers.
We also didn’t see a strong division between strangers on the one hand, and people who knew each other well, on the other. This may be because first impressions can be special: you may feel close to another person because you think you have a lot in common and could become friends.
does how you interact with each other affect synchrony?
Participants used different strategies to sync up their brainwaves. Many people tried: (1) doing something together (2) thinking about the same thing, or (3) eye contact. Which of these strategies do you think made brain synchrony go up?

As you can see, eye contact and doing something together (joint action) are both associated with an increase in synchrony over time. Thinking about the same thing, however, did not appear to increase synchrony.
(1) Doing something together (also referred to as “joint action”): This includes singing a song, having a conversation, smiling, holding or moving hands together, etc. One of the first EEG ‘hyperscanning’ studies, by Guillaume Dumas, already showed that if you do something together, your brainwaves sync up. Later studies by Dumas and others have shown that conversation also synchronizes your brainwaves.
(2) Thinking about the same thing: This includes strategies like retrieving the same memories (“remember when we got stuck in the rain that one time?”), thinking about the same object or experience (“let’s think about ice cream together!”), or thinking about favorite bands or movies. We didn’t find any evidence that this kind of ‘common grounding’ puts people’s brains on the same wavelength. One possible explanation is that EEG isn’t precise enough to capture such joint thought, perhaps because the signal changes too fast. fMRI studies, which measure brain activity at a much slower pace, have shown that our brains respond similarly if we recall the same past experience or think about the same object.
(3) Eye contact: Many pairs used eye contact as a strategy to connect to each other, and we saw that this increased the synchronization of their gamma brain waves, in line with recent findings from other research groups. Some studies looking at brain synchrony between mothers and their babies have also shown that eye contact is a predictor of synchrony. It is not surprising that eye contact increases synchrony: eye contact, and gaze more generally, is a very strong social tool that is pivotal in human relationships. This finding also links to our work Measuring the Magic of Mutual Gaze with performance artist Marina Abramovic: she has used eye gaze as a tool for human connectedness throughout her work, such as The Artist is Present.
do personality and state-of-mind predict brainwave synchrony?
Next, we asked whether people’s social personality traits (empathy), and mental states (focus) predicted their brain synchrony.
brainwave synchrony & empathy

We measured people’s empathy using the Interpersonal Reactivity Index. We specifically focused on the Personal Distress Scale, which reflects the extent to which people experienced "self-oriented feelings of personal anxiety and unease in tense interpersonal settings”.
As can be seen in the scatterplot, more empathetic pairs tended to also show higher brain synchrony. Note that each dot shows the average brainwave synchrony for all pairs that were similarly empathetic on average, which highly simplifies the data.
This has been a pretty consistent finding in our work. For example, more empathetic high school students exhibit more synchrony with their peers during class.
brainwave synchrony & focus
We also saw that synchrony increased for those pairs who remained more focused.
This could mean that shared attention is a requirement for brain synchrony: for example, in other research we found that the more high schoolers attend to class together, and the more they attend to each other, the more their brainwaves synchronize.
[ watch the video to see our classroom research setup ]
does interacting with others affect your mood and social bond?
Does social interaction make you feel happier, more focused, and more interconnected? We asked participants about their focus, mood, and social bond both before and after the experience.
The bar graph shows how people rated their focus, mood and social connectedness to the other person before vs. after participating (i.e., for each self-report measure, you can see if it either increased or decreased).

First, people felt less focused after than before the experience. This could mean that people start out super focused and motivated, but that this ebbs over time. This is also common in regular laboratory experiments, where participants sometimes even fall asleep during the task (especially when they’re lying down). Perhaps more meaningful is that people’s mood improved and that most people felt closer to each other after participating than at the start of the experience. Unsurprisingly, this increase in self-reported social closeness was most prominent for strangers.
These findings relate to previous work showing that face-to-face social interaction makes people happy and healthy, and tightens social bonds.
credits and related work
the team
Matthias Oostrik, Suzanne Dikker, Georgios Michalareas, Peter Burr, Danielle Boelling, Melda Kahraman, Dana Bevilacqua, Marina Abramovic, Amalia Serafimaki, Matthew Patterson-Curry, Lauren Silbert, Pandelis Diamantides, Marijn Struiksma, Phoebe Chen, Laura Noejovich, David Medine, Bogomir Doringer, Olof van Winden, Laura Gwilliams, Jean Jacques Warmerdam, David Poeppel, Annita Apostolaki, Shaista Dhanesar , Imke Kruitwagen, Eletta Daemen, Orsa Rebouskou, Stella Papazisi, Aspa Papazisi, Karlijn Blommers, Sascha Couvee, Ella Bosch, Jorik Geutjes, Irene Navarro, Alba Ortiz, Marta Regidor, Sandra Marquez, Belén Carrillo, Luna Miranda, Ester Abad, África Martín, Estefanía Granados, Iratxe de la Huerta, Isabel Rojo, Keumbee Lee, Patricia Plaza, Noelia Gómez, Brais Alen, and all the local volunteers
organizations
Netherlands Organisation for Scientific Research, VENI grant #275-89-018, EMOTIV, Universiteit Utrecht, NYU Poeppel Lab, Max Planck Institute for Empirical Aesthetics, Max Planck Center for Language, Music, and Emotion (NYU CLaME), TodaysArt, Lexus Hybrid Art, Marina Abramovic Institute, Pioneer Works, 3LD Art & Technology Center, NEON, Fundación Telefónica, Lowlands Festival (Lowlands Science), Nemo Science Center, EYE Filmmuseum, Benaki Art Museum, Creative Industries Fund NL, Nationale Wetenschapsagenda, De Hersenstichting, Stichting Niemeijer Fonds, FORMS Festival, Muse, Silicon Valley Contemporary
related artworks
related research
· Brainwaves sync up in the classroom: original article here and here | selected press coverage here, here, and here
· Friends show the same brain activity: original article here | selected press coverage here
· Brainwave synchrony during pain perception: original article here | layman’s blog here and here
detailed methods
Our brain contains billions of neurons (latest estimate: 86 billion). A primary task of these neurons is to communicate information to each other and to the rest of our body via chemical signals. This process is accompanied by tiny electrical pulses. When lots of neurons fire together (like, when a musical tone reaches auditory cortex), this can be measured on the scalp as “brainwaves”.
Brainwaves oscillate at different frequencies. Some of these brain rhythms have been specifically associated with different types of mental states: For example,
delta waves (1-4 Hz, or: i.e., waves with an oscillation cycle of 1-4 times per second) are dominant during deep sleep.
theta waves (~4-8 Hz) have been associated with focused attention and with language processing
alpha waves (~8-12 Hz) are famous for their link to attentiveness and focus. They are quite easy to measure (for example when you close your eyes) and are often targeted in relaxation programs. It has also been suggested that people with AD(H)D have trouble ‘controlling’ their alpha waves.
beta waves (~12.5 - 25 Hz) are very active during movement, like when you tap your fingers but also when you are merely thinking about tapping your fingers. Some researchers have argued that beta waves encode how concepts and objects are represented in our brains.
gamma waves (~ 25 Hz and higher) are associated with many cognitive activities. Specifically relevant for this research is that gamma waves have been related to eye contact.
EEG (short for electroencephalography) is a tool used by researchers and doctors to measure brainwaves.
Sort of like a set of microphones, electrodes are placed on the scalp to listen in on the ‘conversations’ that take place inside our heads.
In the Mutual Wave Machine, we used the EMOTIV EPOC, which has 14 electrodes.
We are currently testing whether interpretable data during social interactions can also be acquired with the Muse, with 4 electrodes.
A big challenge in EEG research are so-called motion artifacts: the electrodes on the scalp don’t just measure brain activity, they pick up any electric signal in our around the head. And muscular activity is quite electric… so much so that laughing, talking, even moving your eyes or blinking, will occlude brain activity. Some of this can be taken care of by filtering the signal, but not everything. To use the microphone analogy: say you’re using microphones to record a conversation. They will pick up any sound in the room. Some sounds or noise may not be in the same frequency as the people’s voices, so you can filter that out of the signal to hear better what people were saying. But if someone is screaming through a conversation, it is really difficult to ever recover what was said.
Also just like in the case of microphones, from an EEG recording it is much easier to reconstruct when a brain response happened than where it came from. In other words, we won’t be able to conclude anything from the Mutual Wave Machine about which brain regions were involved, but we can say something about whether people’s brain rhythms were showing similar patterns. And that’s exactly what we did.
We used questionnaires that have been very well-validated. For example, the Inclusion of the Other in the Self Scale measures how close people feel to each other, the PANAS-X measures your mood, and the Interpersonal Reactivity Index measures how you react in different social situations. We then asked how each of these responses related to pairs’ brainwave synchrony.
To collect the EEG data, we used the EMOTIV EPOC, an EEG headset with 14 electrodes.
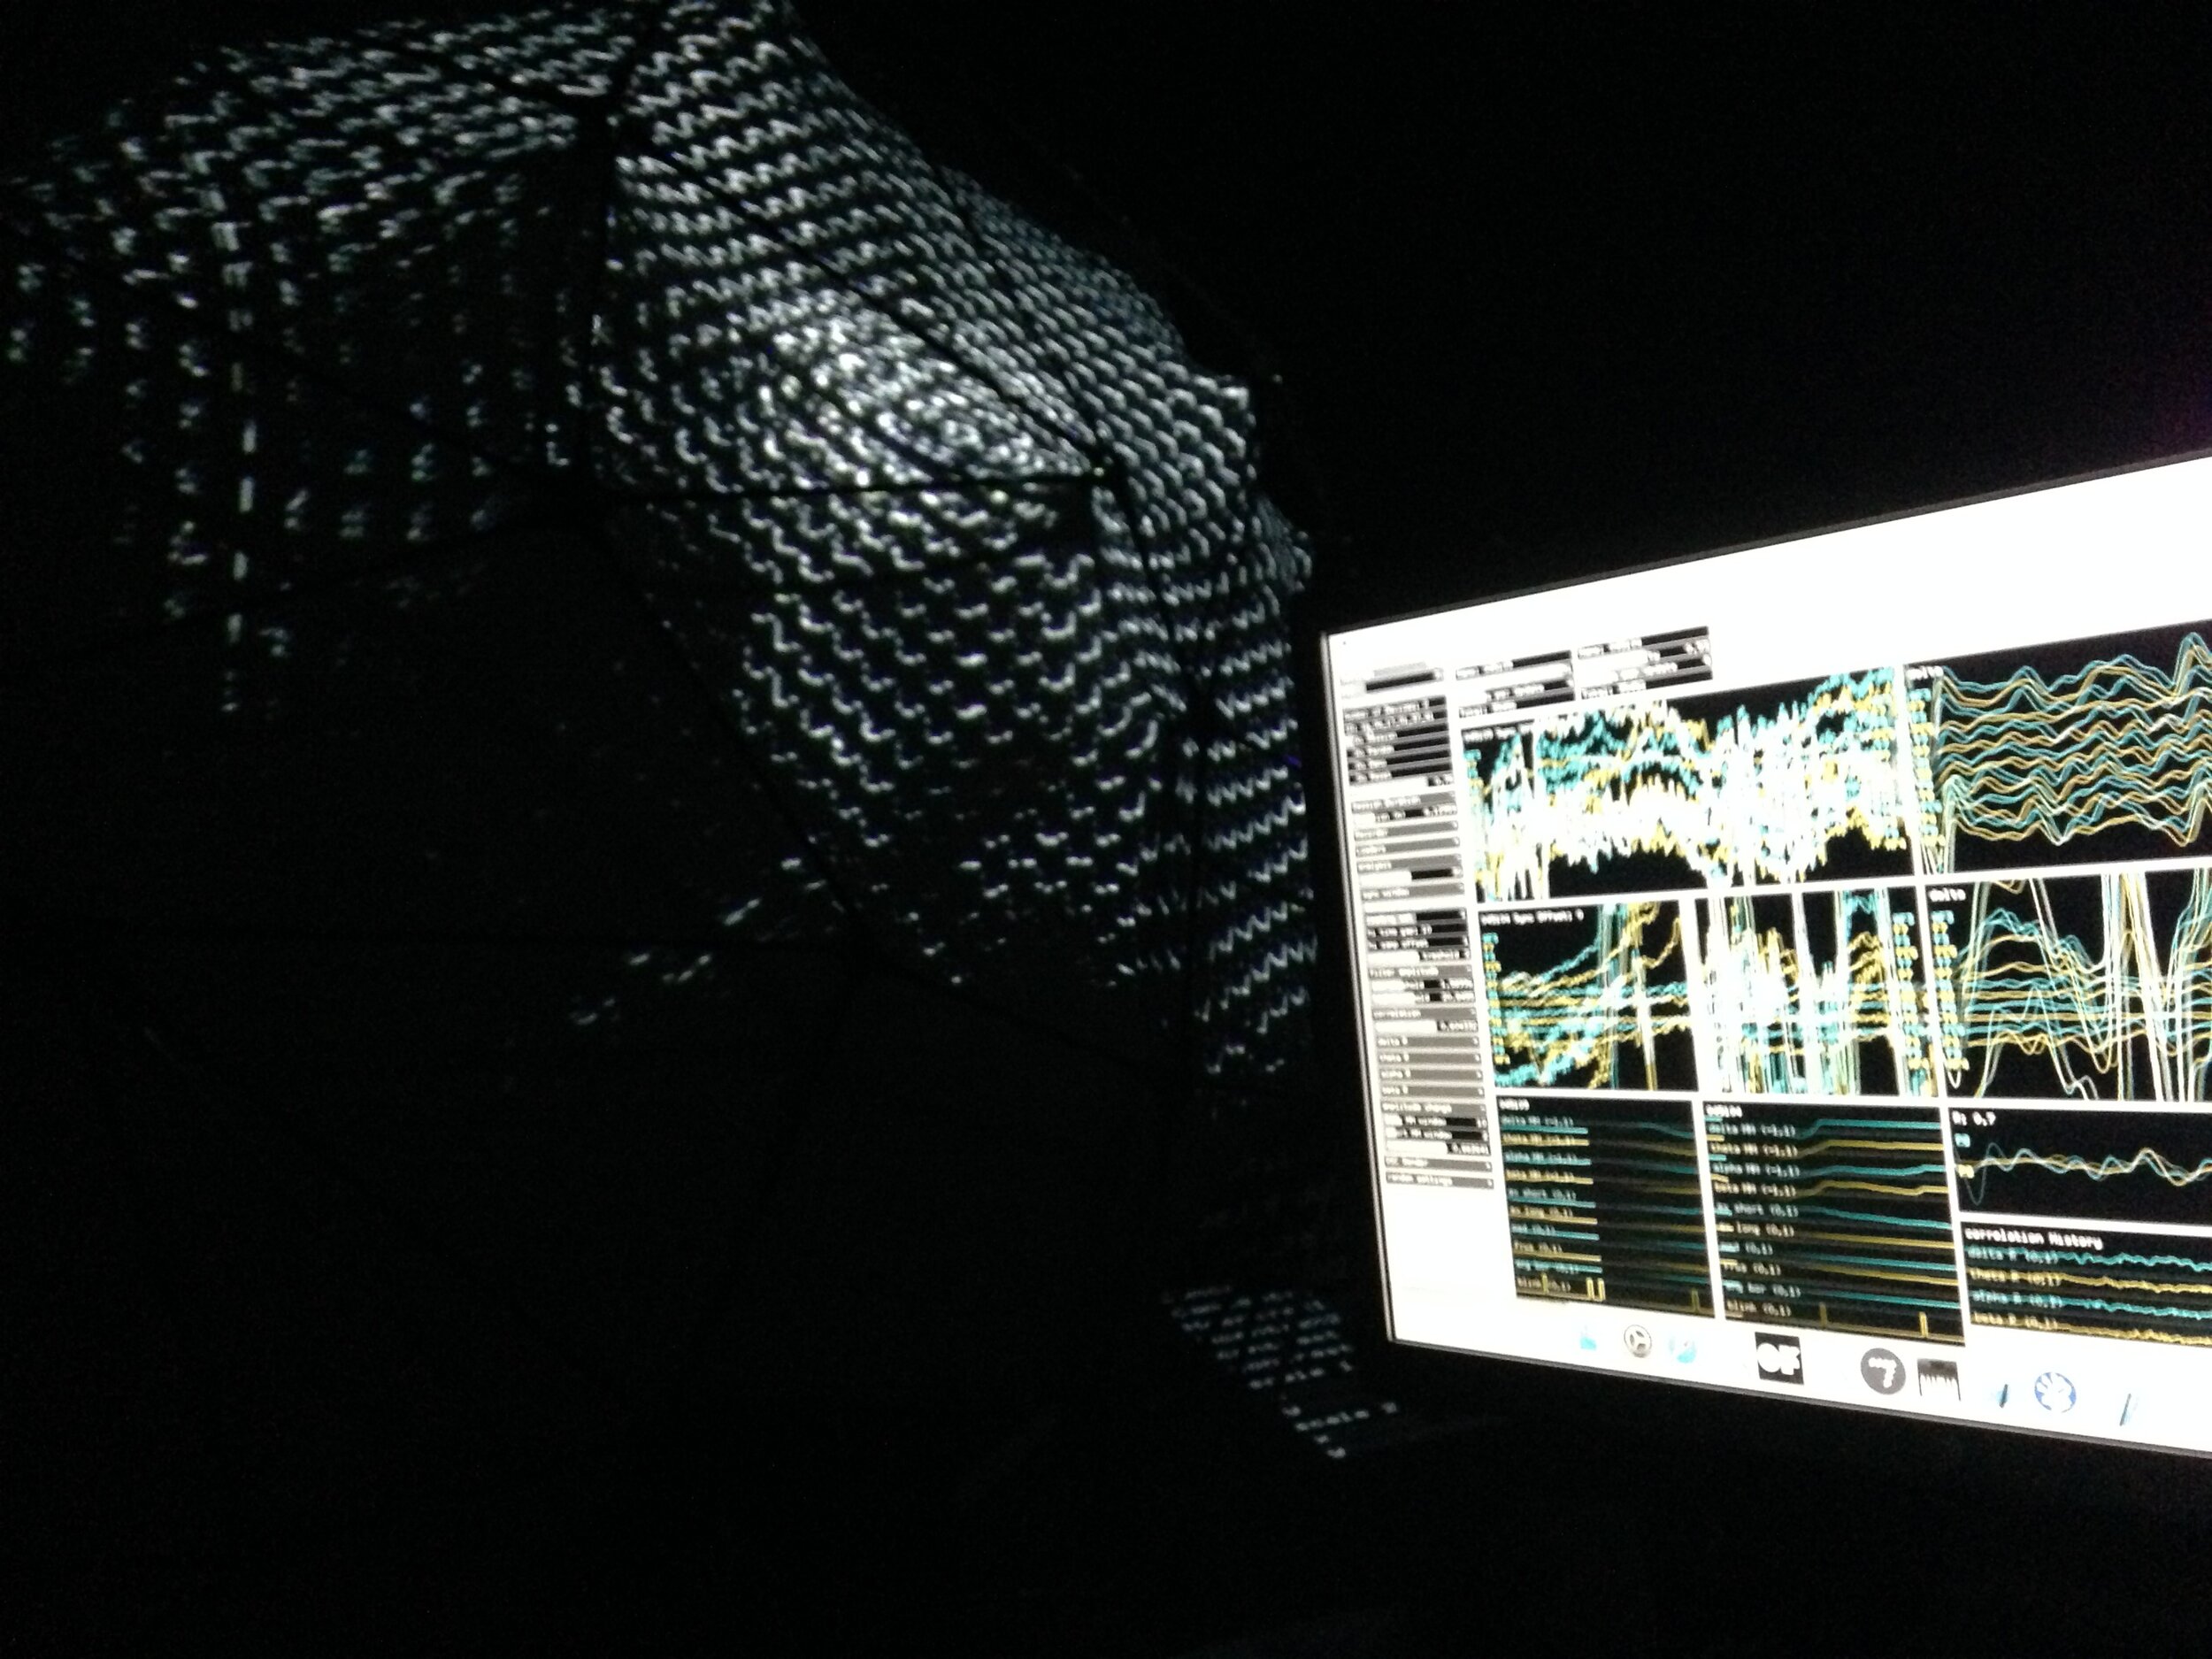
We built software that allowed us to record data from multiple headsets onto a single computer, and we then used openframeworks to analyze and visualize brainwave synchrony in real-time.
We are currently testing whether interpretable data during social interactions can also be acquired with the Muse, a headset with 4 electrodes. We built an iOS app to collect data from the Muse and then transmit it to a mother computer using Lab Streaming Layer. We then use python to compute brainwave synchrony, which is visualized with openframeworks. This is a collaborative effort with David Medine, Jean-Jacques Warmerdam, Laura Gwilliams, and Phoebe Chen. The protocol will be posted to the BCI plus site.
We worked with Peter Burr on the aesthetics of the visuals.
After data collection, Georgios Michalareas wrote a series of MATLAB scripts that clean and analyze data using the FieldTrip toolbox.
First, we discarded datasets with too many motion artifacts or other recording problems.
Then, we cleaned the remaining datasets: this meant removing stretches of data with a lot of noise and electrodes that didn’t have a good enough connection to the scalp to record brainwaves properly.
The data was then filtered into different brainwave frequencies
Then, for each frequency, we computed a few different types of brainwave synchrony. These types largely fall into two different categories: (1) do pairs show similar fluctuations in their brain states? (2) do pairs’ brainwaves show the same shape?
Finally, brainwave synchrony was compared between groups (for example the feedback vs. no feedback groups) and as a function of participants’ responses to the questionnaire questions (for example, empathy).